When planning your IT service management (ITSM) strategy it is crucial to understand how successful your service management efforts are. In this article, we will examine the 8 most popular ITSM metrics and KPIs for assessing the performance of service management and the benefits they offer.
Importance of ITSM Metrics
Nine out of ten customers will make a repeat purchase with your company if they are satisfied with their customer support experience. But how would you characterize excellent customer service? Even though the term “excellent” is subjective, there is a way to determine how well your customer service is performing. That is the power of ITSM metrics.
Metrics are a simple way to measure something, but do not let that fool you. A simple task does not mean an easy one. Check to see if the necessary capacity, availability, continuity, and security are in place. Make sure the metrics can consistently produce the results you expect from them.

ITSM metrics are measurements that give you the quantitative data you need to track the development or performance of your services. You must first clearly identify what you want to measure and then have a strategy for executing it in order to obtain metrics.
Trends are produced when metrics are aggregated. The KPI and the metric summary will show if you need to adjust your course or not. Analyzing ITSM metrics, in the same way, will assist in determining why it is happening. This helps to identify the course deviation’s underlying causes. You can use a variety of strategies to identify the causes of deviation and determine how to make corrections.
A business employs a key performance indicator, or KPI, to quantify how well it is achieving its operational and strategic objectives. Depending on each company’s unique performance standards or priorities, several KPIs are used.
The majority of support organizations use metrics to track and analyze their performance. Unfortunately, by not utilizing the diagnostic performance of KPIs, IT support misses the true benefit of performance assessment in this mode. Only when service and support KPIs are employed holistically can their full potential be realized.
ITSM Metrics You Need the Most
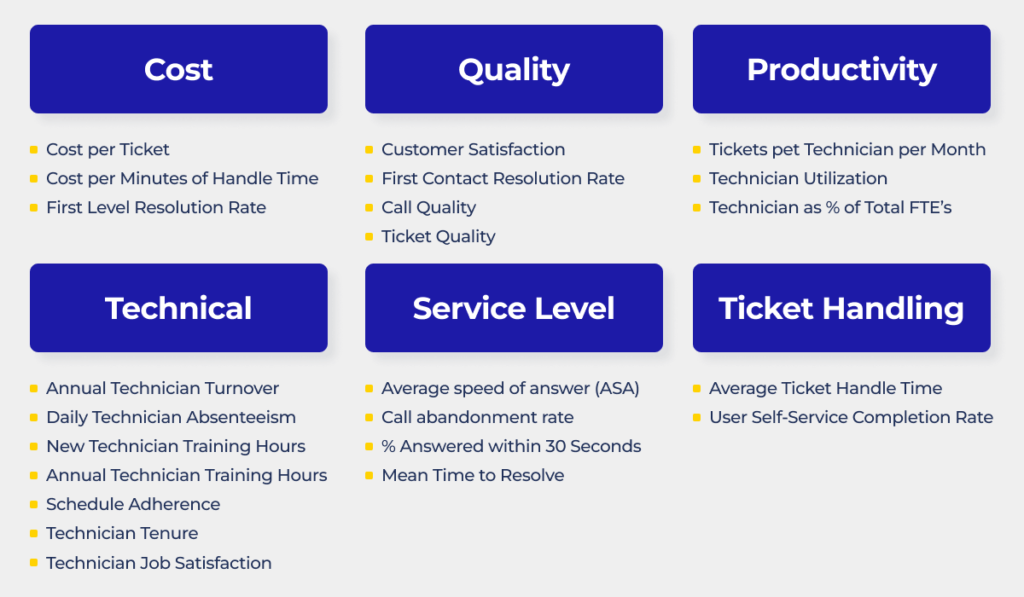
Any IT service management team tracks at least 20 different metrics to trend their performance over time. The most common and important ITSM metrics are explained in detail below.
1. Cost Per Ticket 💰
Cost per ticket, also known as cost per contact, is the total operational expenditure of the service management group divided by the number of tickets or contacts. Usually, a monthly calculation is used for this. Operating costs frequently consist of:
- Staff salaries and benefits
- Software
- Hardware
- Telecommunications
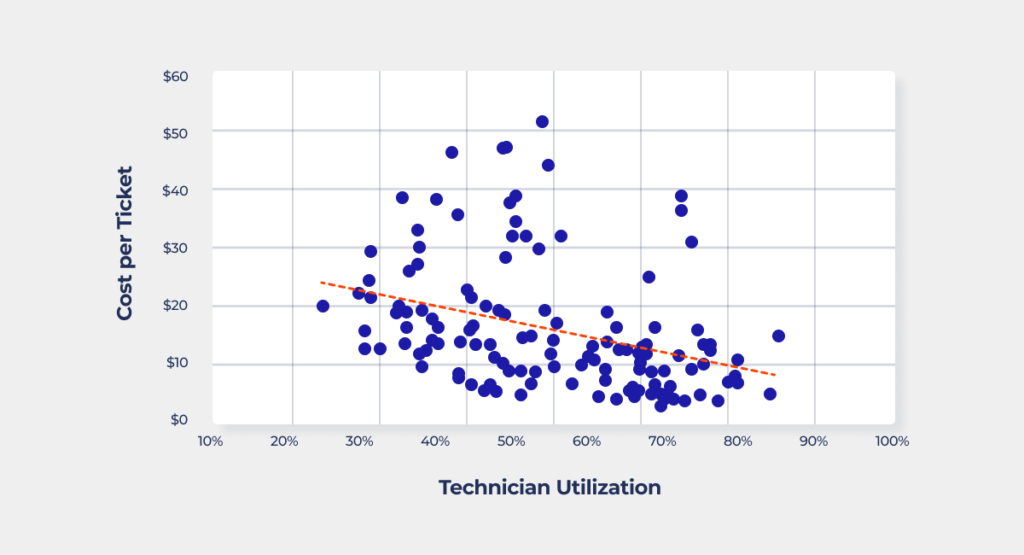
If this metric won’t have an impact on the kind of service your consumers receive, it is a vital business indicator. Analyzing the cost of support and comparing it to other measures like customer satisfaction will help determine whether the firm is investing too much or too little in support.
Using the cost per ticket calculation can show a variety of different scenarios:
- Although your customers are satisfied, your cost per ticket is more than anticipated. You can decide whether the cost is acceptable to you or if you want to improve efficiency to bring down the average cost.
- Spending a lot of money on each ticket doesn’t improve customer happiness. You should investigate the reasons for a large amount of spending.
- Although your cost per ticket is roughly around the regional average, you have above-average consumer satisfaction, which might be a major advantage.
You can use this to determine whether it would be more economical to adopt different service delivery techniques. By enabling users to find solutions on their own before calling or visiting the service desk, adopting an employee self-service portal, for instance, can help lower the cost per ticket.
If your per-ticket cost is high and your customer satisfaction rating is also very high, you might be overspending on assistance. Consider cutting back or shifting some resources.
2. Customer Satisfaction 🤩
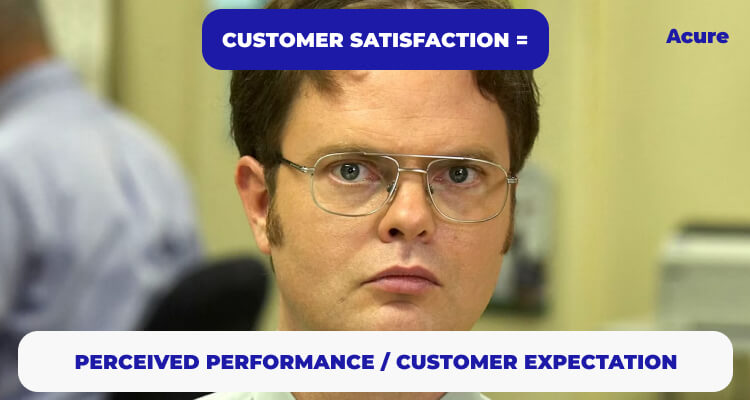
Customer satisfaction is a widely used KPI that measures how satisfied consumers are with the products and services provided by your business. After every encounter with a customer service representative, you should evaluate customer satisfaction. These ratings can be tracked over time to evaluate the effectiveness of particular agents or teams.
In terms of the service desk, customer happiness is actually a fairly recent development. This might take the form of a survey at the end of each encounter, with satisfaction measured by the Net Promoter Score or Customer Effort Score. Whatever approach you use, consistency is key.
A customer effort score is a metric that assesses the level of effort required by a customer to resolve a problem, fulfill a request, make a purchase, return an item or get a question answered. The theory is that consumers will be more devoted to brands that are simple to deal with. You may improve the customer experience by concentrating on lowering consumer effort.
Net Promoter Score (NPS) is another metric used in customer experience programs to evaluate customer satisfaction. It is considered the gold standard statistic for measuring customer satisfaction. A higher NPS score is preferable. NPS scores are calculated using a single-question survey provided with a number from 0-100.
3. First-contact Resolution (FCR) 🤝
Customers like to get their issues fixed at the initial point of contact and dislike being passed from agent to agent. The percentage of cases that are resolved with just one customer contact is known as the first contact resolution rate. Since consumers will exert less effort if they only need to contact your company once, CES will probably be correlated with a high first contact resolution rate.
Additionally, you can assess the average number of responses it takes for a user to get their problem fixed as well as the length of time it takes from the point the customer submits a ticket until it is resolved.
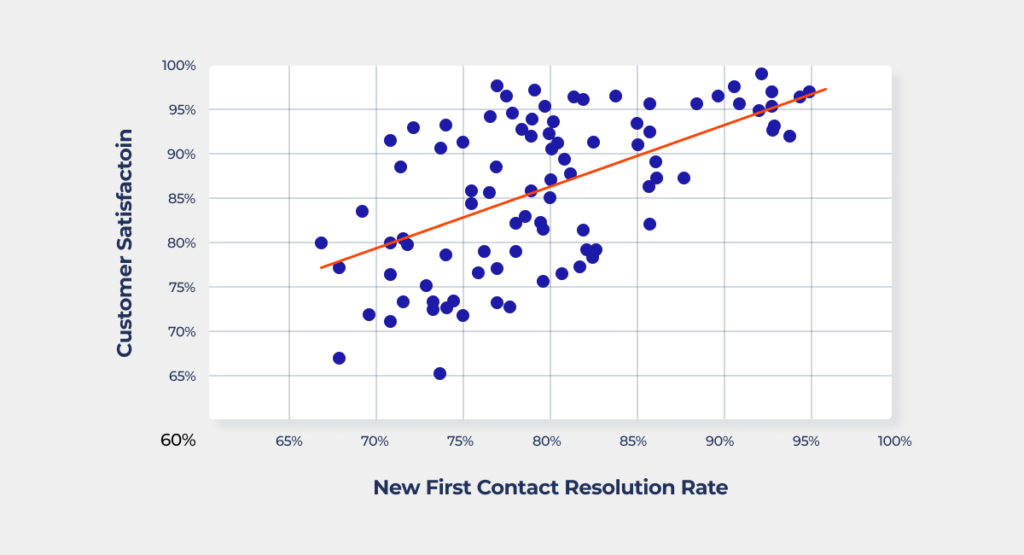
There are two key benefits to monitoring your IT support first contact resolution rate. First, customer satisfaction is significantly influenced by FCR, and second, high levels of customer satisfaction are generally associated with a higher FCR rate.
The FCR can also show the effectiveness of your service desk agent training, the tools you provide them with, even your efficiency to serve more clients with fewer resources, depending on how your IT service desk metrics are configured.
4. Technician Utilization ⚒️
Another crucial field service indicator is technician utilization since it measures the effectiveness of your team’s complete task cycle. It basically counts the activities that take place during billable hours. Your overall business revenue and operational efficiency will increase if your technicians spend more time working on tasks that are important.

What are the causes of the lower-than-average technician utilization?
- Extra time spent getting to the job site
- Ineffective field service management
- The average response time is slow
- Poor planning
- Unorganized field service activities
Although technician productivity and performance may seem like obvious objectives to achieve, it’s essential to know the measures that will enable you to get the most precise results. A technician’s productivity increases with the number of tasks they do.
You might want to add the meantime to repair as well. This parameter shows how long it takes a technician to finish a job. Knowing your team’s average time to repair can assist field service operations, schedule visits, and task planning more effectively in addition to being a valuable KPI to follow.
Your technicians are your most valuable resource, so you need to get the various field service metrics right if you want service delivery to be up to the mark.
5. First-level Resolution 👍
The First Level Resolution Rate measures how often a service desk can resolve tickets at Level 1 without having to escalate them to Level 2, Level 3, Field Support, or Vendor Support.
Consider the case where a Level 1 agent answers a call, and creates a ticket but does not immediately offer the caller a solution. However, the Level 1 agent investigates the user’s problem, finds a workable solution, contacts the user back, relays the solution, and closes the ticket rather than escalating it. Level 1 resolves ticket, even if it wasn’t on the first attempt. It is first-level resolution.
Now, consider a scenario in which a Level 1 agent answers a call, creates a ticket, and then transfers the caller to a Level 3 IT specialist who works in the NOC. Before the user hangs up, the Level 3 professional picks up the call and offers the ticket a resolution. Here, the ticket is resolved at the first contact but it is resolved by Level 3. This is an example of first contact resolution.
It is important to keep in mind that First Level Resolution is a cost metric that significantly affects the Total Cost of Ownership for end-user support, whereas First Contact Resolution is a quality statistic that significantly affects Customer Satisfaction. In particular, if the Level 1 service desk is transferring and pushing contacts to other support levels in order to achieve a low cost per ticket, then it is also significantly raising the TCO.
Achieving a high FLR indicates that you are keeping down costs by resolving problems with less expensive resources in addition to providing a great customer experience. The cost of that contact increases the moment an issue must be escalated to a group, whether it is the security group, the ServiceNow group, or the SAP group.
Determine how the service desk analysts and the escalated support groups may learn more about each other’s jobs. Create pathways and frameworks that let first-level analysts build rapport with escalation support teams and get the data and know-how they need to take on more challenging tasks.

6. Technician Job Satisfaction 🥰
Job satisfaction is a key indicator among technicians that is connected to a variety of other service and support indicators. Job satisfaction will lead to lower turnover, shorter handle times, and higher first-contact resolution rates.

This KPI shows how many successful jobs a technician completes in the allotted amount of time. Many different things can affect it. One may represent how many tasks a dispatcher has completed. The technician’s success rate may not necessarily be great if there are many tasks on the schedule. The KPI, however, improves when more jobs are recognized as done by a client.
The tasks, rescheduling ratio, and repeat visits are other factors to consider. It may be an indication that a technician lacks certain abilities, expertise, or training if he or she frequently rearranges tasks because they cannot be completed as per the scheduled time. A poor success rate could therefore reduce customer satisfaction.
One might assume that a technician’s frequent return visits are a sign of incapacity, incompetence, or ignorance. Performance indicators don’t necessarily show what’s wrong with the worker, but rather what’s wrong with the business. In this instance, providing an employee with the opportunity to expand their skill set through training may be a way to improve customer satisfaction.
To ensure that technicians are maintaining high levels of job satisfaction and excellent morale at work, progressive support organizations evaluate technician job satisfaction at least twice a year. The quality of training, career planning, and coaching offered by world-class support businesses to their technicians is significantly higher than the industry average.
7. Mean Time To Resolve (MTTR) ⏲️
The average amount of time needed to completely fix a failure is called the mean time to resolve. This comprises the time needed to detect the failure, identify the issue, and fix it, as well as the time needed to make sure the failure won’t occur again.
This indicator increases the team’s accountability for long-term performance improvement. It’s the difference between extinguishing a fire versus insulating your home against future fires.
To determine the MTTR, multiply the total resolution time by the incident count for the tracking period. For example, if teams spend an additional two hours putting solutions in place to make sure the system outage doesn’t happen again after your systems were out for two hours in a 24-hour period for a single occurrence, the total time spent fixing the problem would be four hours. Your MTTR is therefore four hours.

The system’s reliability and availability are higher when the MTTR is shorter. This makes MTTR valuable from the perspective of a practical service desk since consumers of IT services expect services to function at their peak for longer periods of time
You can better comprehend variations in your customers’ experiences by keeping an eye on your MTTR. For instance, it could
- Assist you in identifying talks that are going on longer than usual, or that might have been forgotten or lost.
- Assist in classifying more difficult cases that call for the collaboration of several people.
- Mark specific internal procedures that have greater resolution times.
Various teams, geographies, customer types, or product categories may have different MTTR numbers for the same customer support team. Your comprehension of the journeys of your consumers will improve as you track the changes in those ITSM metrics and compare them to one another.
8. The Balanced Score ⭐
The Balanced Score explains an organization’s strategy and vision by turning them into monitored actions. In layman’s terms, it’s a method for determining how well the department or the entire company is doing – an alternative, or preferred, method that goes beyond financial metrics to measure the success of the program.
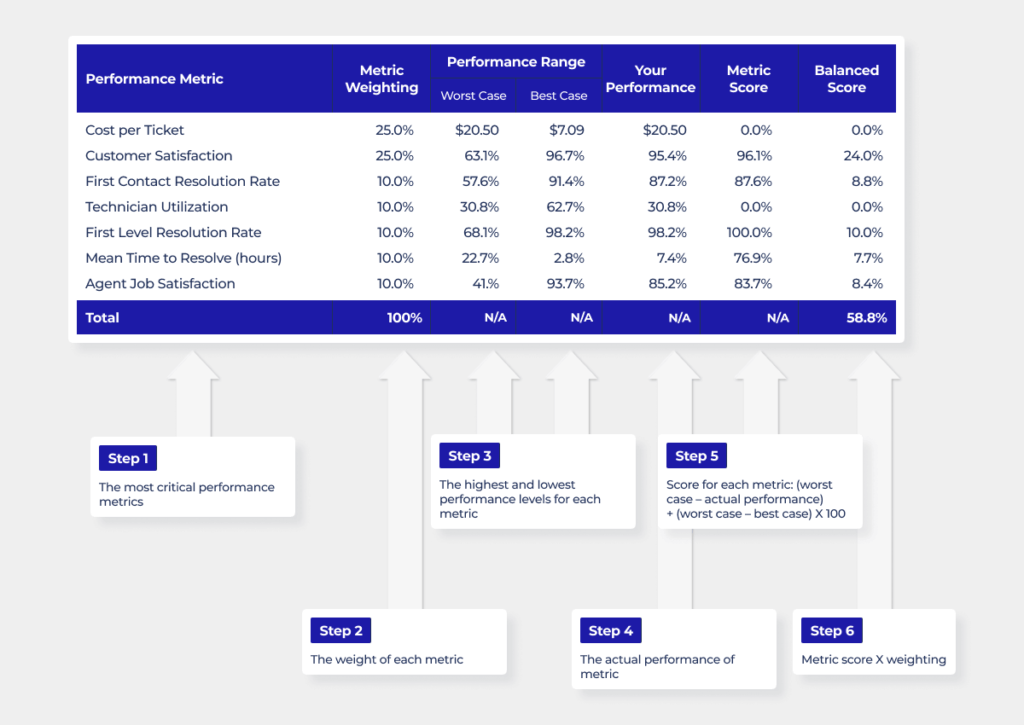
According to MetricNet’s research, it’s important to determine one key performance indicator for your service desk. Because it accurately conveys a balanced picture of service desk performance, we refer to this metric as the balanced score.
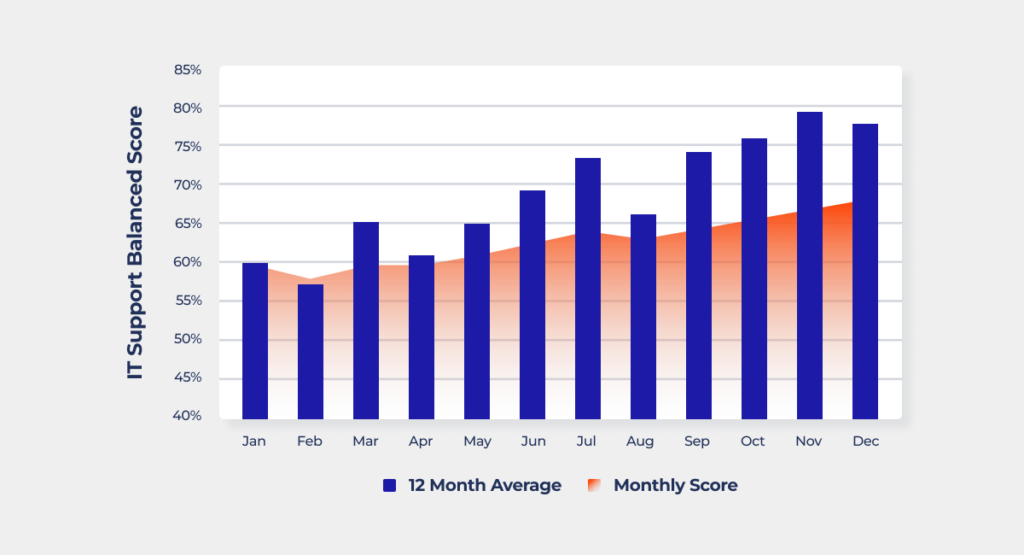
The balanced scorecard is a technique that combines the most relevant service desk performance data, like cost per ticket and customer satisfaction, into a single, all-encompassing figure. When this indicator is monitored over time, it is valuable since it enables you to assess if overall performance is growing better or worse. It additionally offers a helpful baseline for comparing your performance with that of other service desks.
What is the Value of ITSM Metrics?
In terms of ITSM metrics, less is more. The task of directing your support organization towards the best performance can be substantially simplified by monitoring just eight KPIs and applying them diagnostically to impact continual improvement in IT support.
Keep in mind that your customers have the final say in how well you do. In fact, the customer’s opinion is the only one that counts. All other measures support the customer experience. You should look more closely at what you are measuring if your analytics indicate that you are performing well but your customer thinks otherwise.