Why It Is Important to Collect Metrics
Metrics are an essential part of data monitoring. They are used to measure, track and analyze the performance of a system, process or activity. Metrics give us a more objective and accurate view of how a system, process or activity is performing, which helps us identify and address potential problems. Metrics provide a quantitative way of measuring progress and performance of a system, process or activity. They also help identify areas where improvements or changes can be made.
What do Metrics Show 🔍
- First, metrics help to define what data needs to be monitored. By setting KPIs and metrics, businesses can identify which data points are most important and focus their resources on gathering and analyzing that data. Without metrics, businesses may find themselves gathering and analyzing data that is not useful or relevant.
- Second, metrics provide an indication of progress. By tracking certain metrics, businesses can assess their progress toward their goals and objectives. This allows them to adjust their strategies and better focus their resources.
- Third, metrics can help identify areas of improvement. By tracking key metrics, businesses can identify areas that need improvement, such as customer service times or lead generation. This can result in more efficient and cost-effective operations.

Metrics are useful for many applications, including software development, customer service and operational performance.
For software development, metrics can be used to monitor the progress of a project, how quickly tasks are being completed and how defects are being addressed. Metrics can also be used to compare a project’s performance to that of similar projects or to identify areas where additional effort is needed.
Сategories of Metrics
Metrics can be divided into two main categories: quantitative and qualitative.
Quantitative metrics measure the performance of a data system in terms of numbers or data points. Examples of quantitative metrics include throughput, latency and error rates.
Qualitative metrics measure the performance of a data system in terms of user experience or customer satisfaction. Examples of qualitative metrics include customer feedback, user engagement and ease of use.
There are a variety of metrics that can be used to measure performance, depending on the data and the goals of the organization. Some of the most common metrics include:
1. Speed: How quickly data is processed, stored and read from a system. Speed is typically measured in either megabytes per second (MBps) or megabits per second (Mbps).
2. Availability: A measure of how often a system is available and how quickly it can respond to requests. This metric is usually expressed as a percentage.
3. Response time: The amount of time it takes for a system to respond to a user’s request. Response time is usually measure in milliseconds.
4. Latency: The delay between when a request is made and when it is fulfilled by the system. Latency is typically measured in milliseconds.
5. Throughput: Measures the amount of work that can be performed by the system within a specific period of time. Throughput is typically measured in number of transactions per second (TPS).
6. Accuracy: Measures the accuracy of information received from the system. Accuracy is typically measured in the percentage of occurrence of a problem.
7. Reliability: Measures the probability of the system being available for use when needed. Reliability is typically measured in uptime percentage of time that a system is available for use.
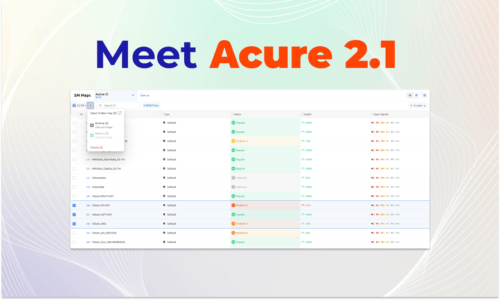
Acure 2.2
The Collection of Metrics in the New Release 🗂️
Of course, all of the above could not be ignored by Acure. Therefore, a notable update in version 2.2 is a basic implementation for collecting and storing metrics in the system.
Сollecting metrics is carried out through the Data Stream.
The created data stream allows you to simultaneously receive event information (logs), as well as metric data.
For example, for Prometheus to send metrics to the Data Stream, you will need an API key copied from the settings of the corresponding Data Stream.
Based on this, a full-fledged service for analyzing time series and creating rules for managing thresholds is coming soon. UI for managing metrics in the system to create a signal and link it to CI will be implemented in the next release.

The Statistics of the Data Stream (Including Metrics) 📊
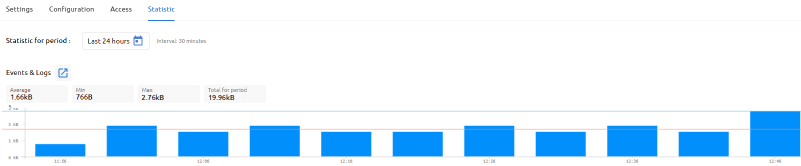
In the new release, Data Streams got a Statistics tab, where users can access information about the events (logs) and metrics collected in the data stream.
Information is presented in the form of histograms with statistical indicators.
The Histogram of Events and Logs displays the amount of data received through the Data Stream for the selected period of time with the following indicators:
- Amount of data for the selected period
- Average amount of data for the selected period = amount of data for the period / number of timeslots of the period
- The maximum amount of data for the selected period = the maximum amount of one of the time intervals of the period
- The minimum amount of data for the selected period = the minimum amount of one of the time intervals of the period
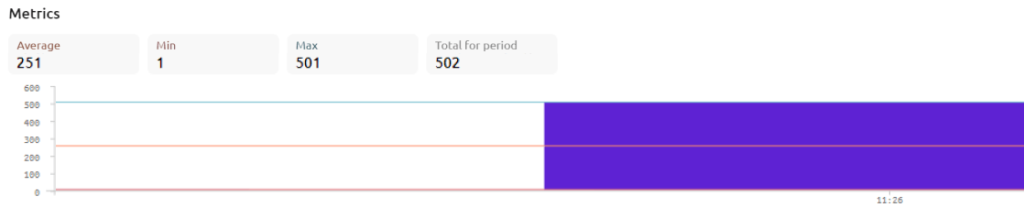
The Histogram of Metrics displays the number of Metrics collected from the Data Stream for the selected period of time with the following indicators:
- Quantity for the selected period
- Average quantity for the selected period = number for the period / number of timeslots of the period
- The maximum quantity for the selected period = the maximum amount of one of the time intervals of the period
- The minimum quantity for the selected period = the minimum quantity of one of the time intervals of the period
What Else is in the Release
🔥 A new version of the Acure Agent with a built-in HTTP plugin was released. This allows requests to the API of external information systems on the Acure system Agent.
🔥 In the same release, a new functionality for managing CI types through the system interface has been implemented, which is a significant development of the CMDB service.
🔥 Last but not least, Acure added the functionality of providing access to Signals to other Workgroups, which already have access to Signal-related CIs.