Network monitoring is a process when all networking components, including routers, switches, firewalls, servers, and virtual machines (VMs), are regularly reviewed and monitored for faults and performance.
Effective network monitoring should identify performance issues and bottleneck aids in the early detection of problems. Proactive monitoring can help avoid network downtime or failures.
The Most Important Advantages Of Network Monitoring
Complete Network Visibility
Network monitoring provides managers with a detailed overview of all the linked devices on a network. It shows how data flows across them and allows to rapidly find and resolve critical incidents and prevent them in the future.
Improved Use of IT Resources
Network monitoring systems’ hardware and software technologies decrease manual effort for IT staff. This means that valued IT employees can dedicate more time to key organizational tasks.

The Capacity To Detect Security Risks More Quickly
Network monitoring assists companies in understanding what “typical” network performance looks like. As a result, when odd behavior happens, such as an inexplicable surge in network traffic levels, administrators may rapidly identify the problem—and evaluate whether it is serious.
Early Detection Of Future Infrastructure Requirements
Network monitoring systems can generate information on how network components behaved over time. Network administrators can predict when the firm may need to consider updating or adopting new IT infrastructure by examining these reports.
Who Is Responsible For Network Monitoring
The network administrator is responsible for the proper functioning of the network infrastructure and must perform the following daily:
- Checking the health of servers, Internet connection, e-mail, other applications, as well as office equipment;
- Side connection to servers;
- Checking free space on hard drives, RAM and other capacities;
- Verification of data backup implementation.
The ongoing activity is aimed at the timely detection of errors in the operation of software and hardware, which minimizes the risk of critical problems.

An alternative to a network administrator is automatic monitoring systems that can check workstations, servers, site availability, client and server applications and services, printers, scanners and other network equipment.
Network monitoring systems are indispensable assistants to network administrators. They allow not only collecting but also visualizing, structuring and sorting information about infrastructure components and events, as well as independently notifying administrators about incidents, reducing the time to eliminate them.
The Main Functions Of Network Monitoring Systems
Discovering 🔍
Every network monitoring begins with the process of discovering. Obviously, you can’t monitor a network until you know what’s on it.
Network monitoring tools like Acure.io find every device on the network, including routers, switches, firewalls, servers, printers, and more. A network monitoring system automatically assigns the proper device role to each identified device when the discovery procedure is complete.
But discovering the components is only the start. You must understand the connections between the elements in order to monitor the network effectively. Because an issue with one device’s performance may affect another’s.
For instance, when a switch malfunctions, the whole network of devices attached to that switch cannot interact. If this is the switch linking the servers hosting an organization’s CRM system, there is a critical problem.
In the future, understanding the relationships between the components of the system will help to perform not only the root cause but also the impact analysis.
Network Vizualization 📊
Their eyes are a network administrator’s most important diagnostic tool. They can save spending hours debugging network issues.
Network monitoring systems should provide network maps to assist network administrators in visualizing their networks. Network maps give users a clear and organized visual overview of the devices in a network, their connections, and the most recent status.
Some programs just offer a sketching tool, leaving network mapping to the administrator’s expertise. Other platforms, like Acure.io, can perform auto-discovering of all system elements and their connections and transform them into a full map in the form of topology. You can monitor the health of both the entire system and each configuration item separately and customize the map in a way that suits you the most.
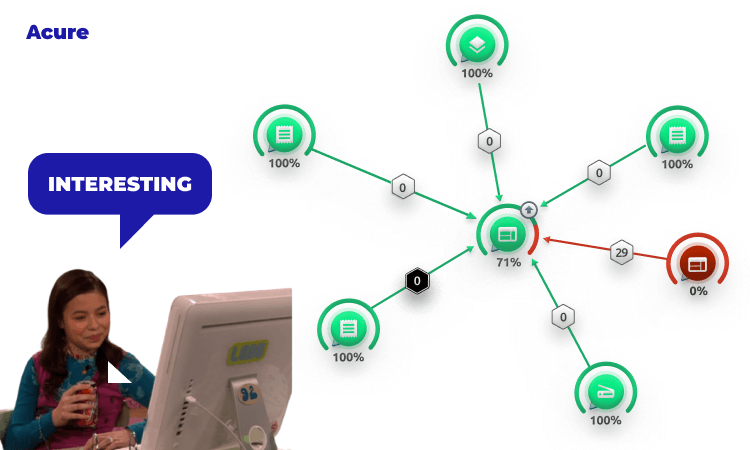
Proper visualization helps reduce incident resolution time. With auto-discovered relationships, you can quickly identify the root cause, saving time on troubleshooting rather than searching.
Constant Monitoring 💻
Turn-key device responsibilities that specify what needs to be monitored are provided by network monitoring software. Device roles can be changed by network administrators, or new ones can be created entirely. Monitoring tools give network administrators access to a wide range of monitors. Network administrators should first keep an eye on CPU, memory, disk and interface usage as well as Ping availability and latency.
The majority of network monitoring software also tracks temperature in wire closets and other hardware elements like fans and power supply in switches. Additionally, they may keep an eye on network services like HTTP, TCP/IP, and FTP.
Alerts and Notifications 📧
Network administrators may respond to issues before they have an impact on users, apps, or the company. That’s why network monitoring systems should immediately alert network administrators when a problem occurs. They send out notifications by text, email, and logging.
CPU, memory, and interface usage are performance measures that change during the day. During times of peak usage, they may go beyond thresholds for a few seconds or minutes. Network administrators don’t want to deal with these small hiccups. Notifications from monitoring systems are set up with a time element to prevent this.

Network admins also need sleeping mode. But unfortunately, a lot of them should be ready for alerts they are stormed with 24/7. Some systems allow administrators to set blackout times during which notifications are disabled. Often alerts are duplicated, so many engineers do the same thing, which leads to additional time and money costs. To avoid storm alerts, monitoring systems use functions of noise reduction. For example, Acure.io allows sorting events by priority and shows only important notifications.
SLA Reports 📉
Network administrators are actively involved in the ongoing planning, analysis, and redesign of the network. The network monitoring systems offer both historical and real-time monitoring data to support this life cycle.
Network administrators can use this information to:
- Verify that network designs are producing the desired results
- Show that SLA commitments are being met
- Expose trends to deliver the performance required by users, applications, and the business
- Rapidly identify and resolve performance issues
Network monitoring programs are indispensable assistants for every system administrator. They allow you to quickly respond to anomalous activity within the local network, keep abreast of all network processes and, thus, automate some of the administrator’s routine activities: primarily those related to network security. Let’s take a look at which network monitoring programs are relevant in 2022.
Popular Network Monitoring Tools (2022)
1. Zabbix
Zabbix is a proper solution for networks and applications which uses a fascinating robust tool for monitoring and event correlation.
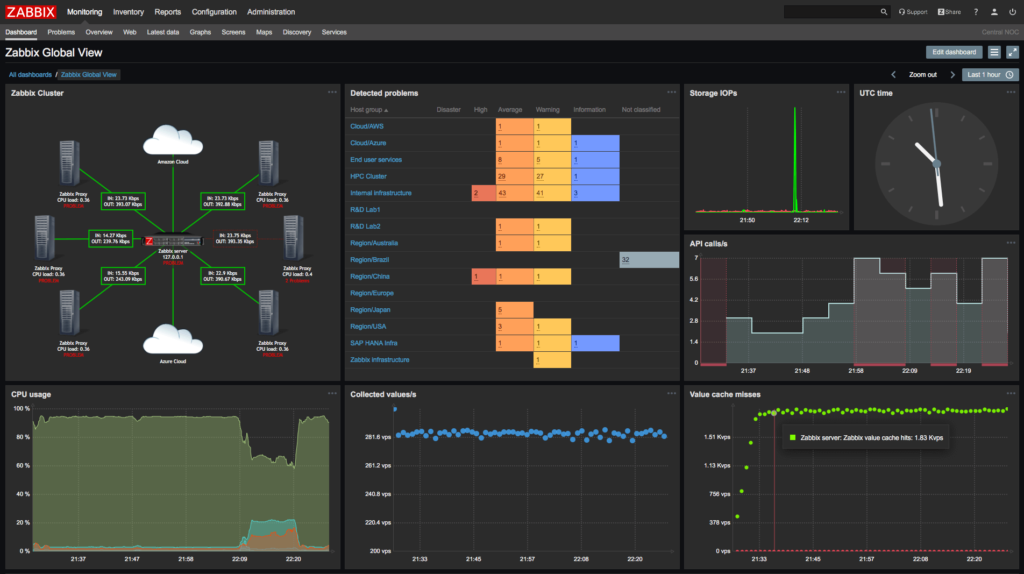
Zabbix allows you to customize your dashboards and web interface to focus on the most important network components. Notifications and problem escalations can be based on custom actions that are applied to hosts or groups of hosts. Actions can even be configured to run remote commands, so some script of yours can run on a controlled host if certain event criteria are observed.
The program graphs shows data such as network bandwidth and CPU usage and collects it for custom display systems. In addition, Zabbix supports customizable maps, screens, and even slideshows showing the current status of monitored devices.
Basically, Zabbix works with software agents running on monitored systems. But this solution can also work without agents, using the SNMP protocol or other monitoring capabilities. Zabbix supports VMware and other virtualization hypervisors by providing detailed hypervisor performance and activity data. Particular attention is also paid to the monitoring of Java application servers, web services and databases.
Hosts can be added manually or through an automatic discovery process. A wide range of default templates apply to the most common use cases such as Linux, FreeBSD and Windows servers; widely used services such as SMTP and HTTP as well as ICMP and IPMI for detailed network hardware monitoring. In addition, custom checks written in Perl, Python or almost any other language can be integrated into Zabbix.
💰 Zabbix is free since it was released under the GPL license. There are no limitations on the number of monitored devices, you can use Zabbix to monitor many thousands of devices absolutely free.
2. Acure
Acure is a newly released cloud-based AIOps observability and automation patform that offers a single, interactive ecosystem for monitoring and resolving common cases encountered by modern IT environments.
Acure has a simple and user-fiendly interface that allows the creation of a workspace in seconds. You can also connect it to popular IT monitoring systems, such as Zabbix or Prometheus, using templates or manually, add data from virtualization systems, such as VMware, add Azure or AWS cloud providers, collect raw logs from your services.
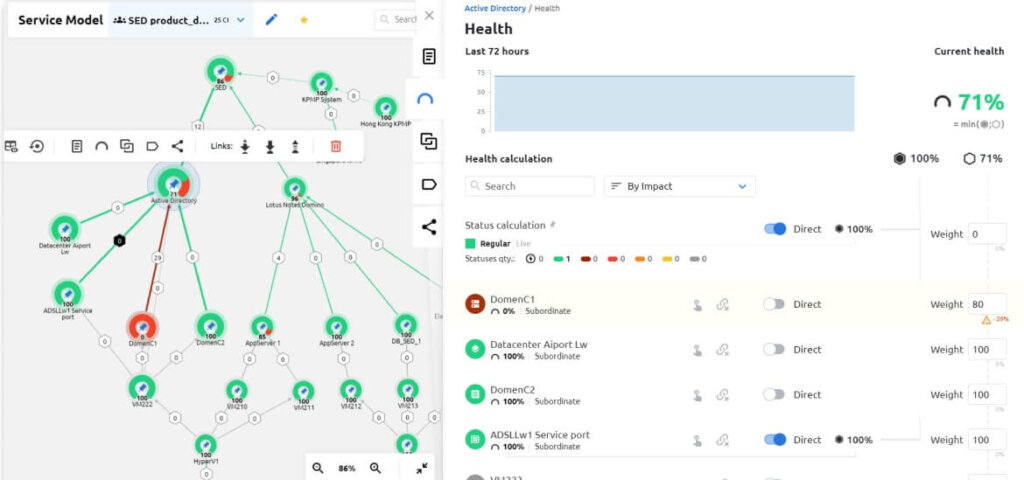
As it was mentioned in examples before, Acure automatically discovers configuration items and connections between them to place them on automatic monitoring. IT infrastructure is visualized as a topology graph which shows connections, subordinations and the health of configurations units. IT allows you to quickly and efficiently perform root cause and impact analysis.
Acure automates not only discovering but also rules and actions. You can create scripts and use automation to make changes smoothly to the whole system without extra efforts. The Plugins system allows the administrator to create and add automated notification methods via e-mail, sms or popular messengers.
Acure also has automated testing feature to set up checks that can imitate user actions and report any anomalies as they run, even when infrastructure monitoring does not signal a problem.
💰 Pricing of this software is $0 which offers: unlimited events, unlimited users, unlimited automation rules, up to 5GB of daily incoming data and up to 100 tests daily.
3. Nagios
Nagios is an established network monitoring software system that has been in active development for many years. It can be difficult for beginners, but the rather complex configuration is also an advantage of this tool, as it can be adapted to almost any monitoring task.
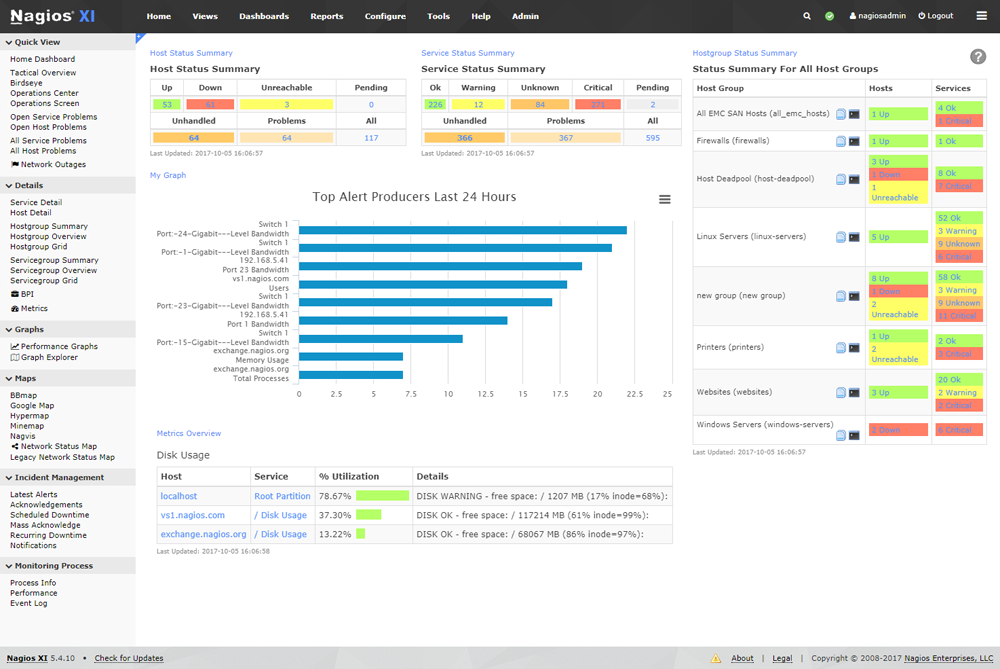
Nagios monitors all mission-critical infrastructure components, including applications, services, operating systems, network protocols, system metrics, and network infrastructure. Multiple APIs allow for easy interaction with both internal and external applications.
The platform offers a custom email, SMS and instant messaging notification mechanism for most popular messengers.
In addition, the display feature shows all monitored devices in a logical, color-coded representation of their location on the network, allowing problems to be shown as they occur.
💰 Nagios is completely free.
4. Icinga
Icinga started as a branch of the Nagios monitoring system, but has recently been rewritten into a standalone solution known as Icinga 2. However, Icinga 1 is compatible with a large number of Nagios plugins and configuration. Icinga 2 was designed to be less bulky, performance-oriented, and more user-friendly. It offers a modular architecture and multi-threaded design that neither Nagios nor Icinga 1 has.
There are several variations of the web interface for Icinga, but the main difference between this monitoring software solution and Nagios is the configuration that can be done through the web interface rather than through configuration files.
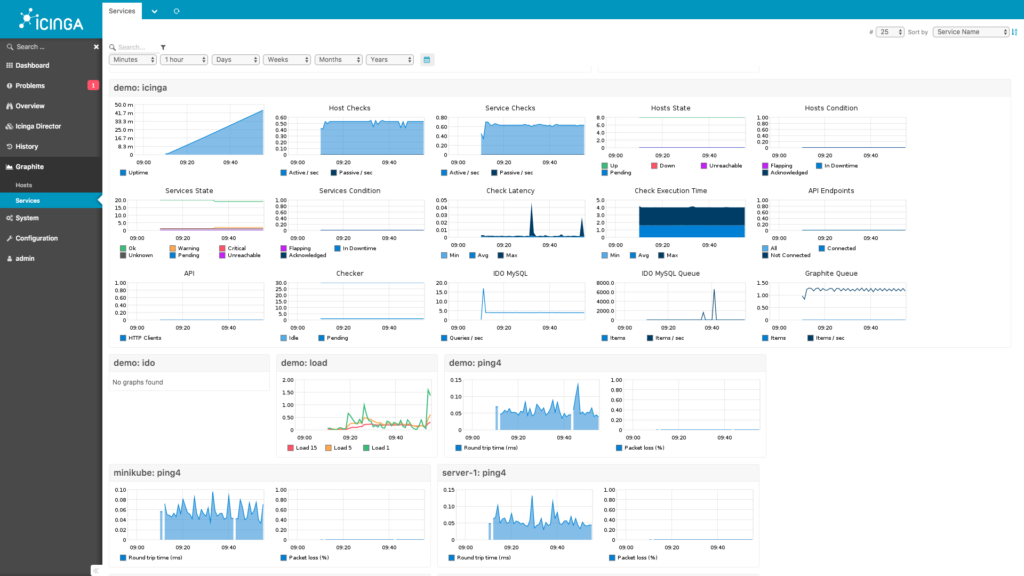
Icinga integrates with a variety of monitoring and graphical display software packages such as PNP4Nagios, inGraph and Graphite to provide a robust visualization of your network. In addition, Icinga has advanced reporting capabilities.
💰 Also free like Nagios.
5. Datadog Network Monitoring
Datadog Network Monitoring helps to monitor the performance of network devices.The technology, which is cloud-based, can scan a network to find every connected device. The network monitor will compile an asset list and a network topology diagram using the data from this study. By using this method, the system runs its own setup processes.
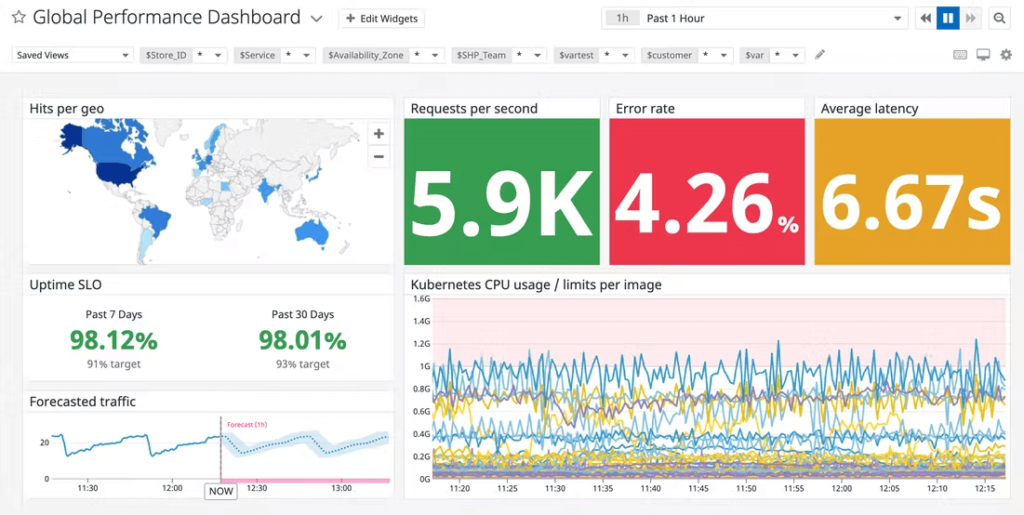
Any modifications you make to your network are immediately picked up by the continuous autodiscovery process, which also refreshes the inventory and topology map. Additionally, the program can recognize virtual systems and expand connection monitoring to include cloud resources.
End-to-end visibility of all connections is provided by Datadog Network Monitoring, which is also associated with performance problems shown in log messages.
The system’s dashboard is available through any common browser and is stored in the cloud. This gathers data on network performance from many sources, centralizes it, and covers the complete network, end to end and link by link.
💰 Datadog has a free version for up to five hosts.
6. Cacti
Cacti is a program included in the LAMP suite of server software that provides a standardized software platform for plotting virtually any statistical data. There are templates for monitoring a wide range of equipment, from Linux and Windows servers to Cisco routers and switches, basically anything that talks on SNMP (Simple Network Management Protocol). There are also collections of third-party templates that further expand the already huge list of Cacti-compatible hardware and software.
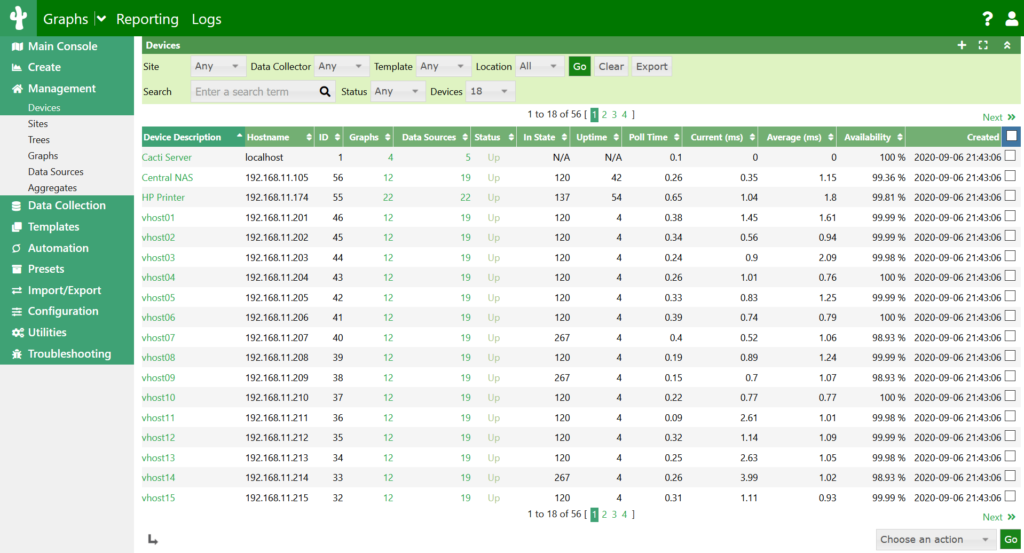
Using Network Weathermap, a PHP plugin for Cacti, you can effortlessly create real-time maps of your network showing the congestion of communication channels between network devices, implemented using graphs that appear when you hover over the network channel image
Cacti is a powerful graphing and trending network performance toolkit that can be used to monitor virtually any monitored metric in a graph. The solution also supports almost limitless customization options, which can make it overly complex for certain applications.
💰 Cacti is absolutley free.
7. Auvik
Auvik is a variety of system management tools included in the cloud-based network monitoring solution.
A network discovery procedure is the first step in the service offered by Auvik. This automatically fills in all of the fundamental data required for the monitor to function.
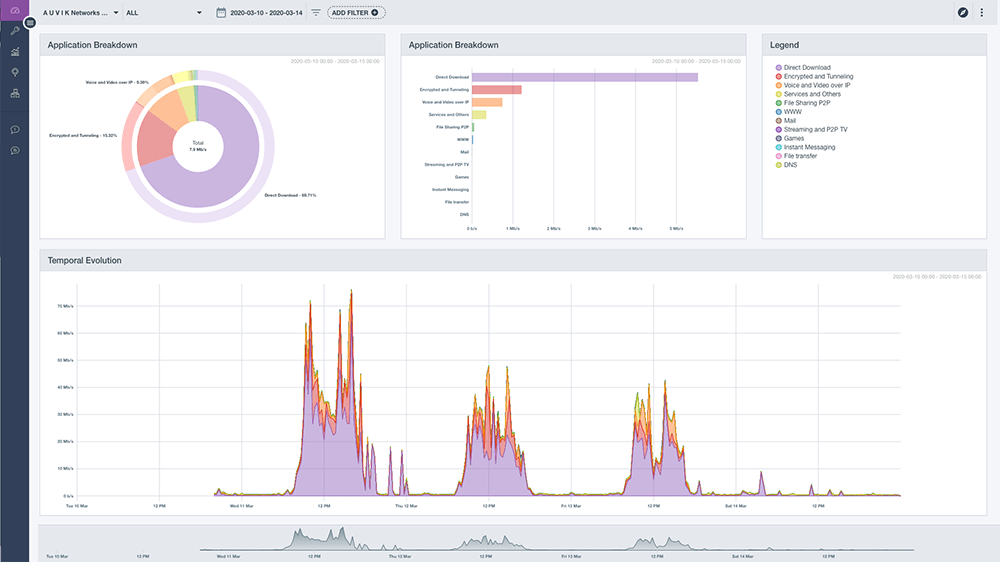
The usage of third-party products for which the network monitor has connectors allows Auvik to be expanded.
Auvik is built for remote system monitoring. A set of thresholds is used to monitor networks. A threshold for resource utilization or system performance is applied to each of the network activity metrics that the service monitors. A warning will be generated by the Auvik service if that threshold level is exceeded. This implies that unless a problem manifests, your team of technicians need not pay attention to the network.
💰 Auvik offers 14-day free trial version.
8. SolarWinds
SolarWinds Network Performance Monitor is the network performance monitoring tool that can track device status via SNMP. It has the ability to automatically find network devices linked to your network. Utilize the dashboard to keep a close eye on the performance and availability of all connected network devices.
A network topology map, which shows how your infrastructure is connected, may also be used to see any found devices, programs, or services. The NetPath function enables you to track packet transfers hop-by-hop, which can aid in more accurately identifying the cause of performance network problems.
You can specify alert trigger circumstances using the custom alerts system. The program will notify you through email or SMS when the trigger requirements are satisfied to let you know that an event has occurred.
💰 SolarWinds provides you with 30-days free trial.
***
Network monitoring is important to understand how well the network is operating. The network administrator can control various aspects of the network, such as bandwidth usage, server performance, and security.
Monitoring can be done manually, but it is better to use network monitoring tools that monitor various aspects of the network and help administrators keep an eye on the health of the network and save time thrugh automation and clear system visualization.
Therefore, no matter which of these above systems you use, it will provide you with at least the functionality of another system administrator.