To understand the whole picture, you need a view from above, collecting all the important signals in one system and working with big data in it. In the case of AIOps, we collect data on all logs, events, metrics and traces, then we build the service topology and algorithmically determine the health status.
What is Log Monitoring?
Collecting logs for future observation is called log monitoring. It is the process of categorizing logs and searching for abnormalities that might cause system problems.
The Steps of Logs Processing
In the processing logs, at least four stages can be distinguished:
1. Collecting logs from servers and containers using agents and sending them via network protocols to a centralized repository either directly or through aggregators with pre-processing;
2. Log messages are parsed inside the aggregators, enriched with additional information (time stamp, source ID, location tag, etc.), converted to a single format and sent to storage ready for indexing;
3. Direct storage of logs and storage management;
4. Analysis and visualization of data obtained from logs.

Log Monitoring Tools You Can Use for Free ✨
There are about a hundred software solutions on the market with the required propensity to collect and analyze logs. In this article, we will look at 4 popular FREE log monitoring tools and compare their functionality as aggregators, a storage system and instruments of visualization.
- ELK Stack
- Graylog Open
- Acure
- Grafana Loki
1. ElasticSearch + Logstash + Kibana
ElasticSearch, Logstash and Kibana were originally developed as open source products and developed separately from each other, but in 2015 they merged under the Elastic brand and began to be a single product – the ELK stack.
Logstash is a server-side data processing pipeline that simultaneously receives data from multiple sources, transforms it, and then sends the processed data to Elasticsearch storage. The main functionality of Logstash as a log aggregator is the following:
- The ability to accept data in different formats and different sizes from many sources using all sorts of input plugins;
- Processing of input data using separate plugins;
- Output plugins are used to send processed structured logs to various data storage systems (most often Elasticsearch), message brokers (kafka, redis), etc.
- Logstash has the ability to use different codecs to decode and encode input and output data: the main ones are plain for working with Plain text messages and JSON for working with events in JSON format.
- The processing pipeline configuration is set in a simple text file.
The centerpiece of the ELK stack is Elasticsearch, a high-performance full-text search engine based on the Apache Lucene open-source library. It combines the functions of a database, as well as a search and analytics engine, with the following main features:
- Elasticsearch is non-relational document-oriented data storage (NoSQL) in JSON format without strict structure;
- All work with the database is based on JSON requests using the REST API, which allows you to add, view, modify and delete data, issue documents by index, calculate various statistics;
- The absence of a schema allows you to upload any text documents to the storage and index them automatically;
- The indexing procedure consists in processing the text of the document by the analyzer and adding the output set of tokens to the search index;
- Elasticsearch provides fast and flexible full-text search across all fields in all data warehouse documents (words from a query are searched by index);
- Support of several different fuzzy search methods,
- Work with texts of oriental languages CJK (Chinese, Japanese, Korean) is supported;
- Elasticsearch has high scale-out and replication capabilities for high-load projects with large volumes of data, as well as relatively easy management and good fault tolerance.
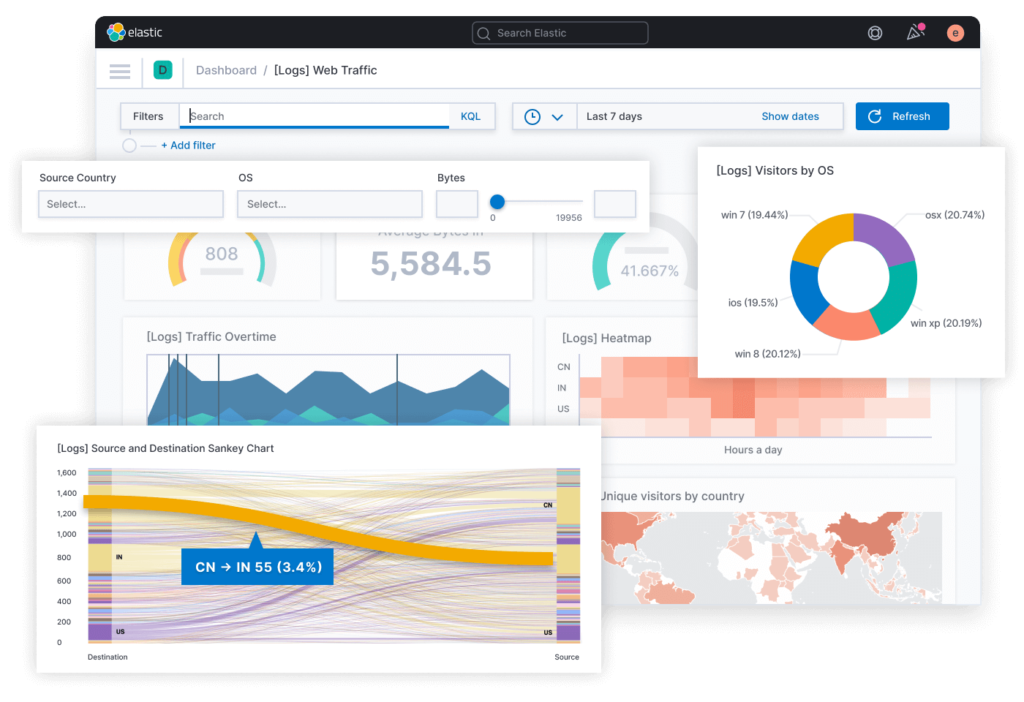
Kibana, as part of the ELK stack, is the tool responsible for presenting search query results to Elasticsearch in a human-readable form. In essence, Kibana is a web interface for searching, viewing and interacting with documents in the data warehouse, allowing you to:
- send search queries to Elasticsearch (using special KQL syntax, Kibana Query Language) and carry out all kinds of filtering of the results obtained,
- analyze data and visualize the results in the form of various charts, histograms, tables, graphs, maps, etc.,
- create, modify, save and load custom dashboards that combine several visualizations on one screen, and third-party dashboards can also be loaded,
- administrate Elasticsearch data warehouse, manage indexes and processing pipelines,
- manage the rights and levels of user access to different elements of the system.
It should be noted that in the latest versions (starting from 7.14) Elastic actually switched to collecting logs using their own agent programs (Elastic Agents) installed on servers and containers instead of using input plugins for Logstash.
Elastic Agent is a single, unified way to add monitoring of logs, metrics, and other types of data per node, making it easier and faster to deploy monitoring in a large system.
The Kibana web interface has an additional Fleet panel that can be used to add and manage agents, and you can also install ready-made integrations for popular services and platforms from it. The integrations provide a fairly simple and fast way to connect standard data sources, plus they come with customized elements such as dashboards, visualizations, and pipelines for extracting structured fields from log messages.
2. Graylog Open
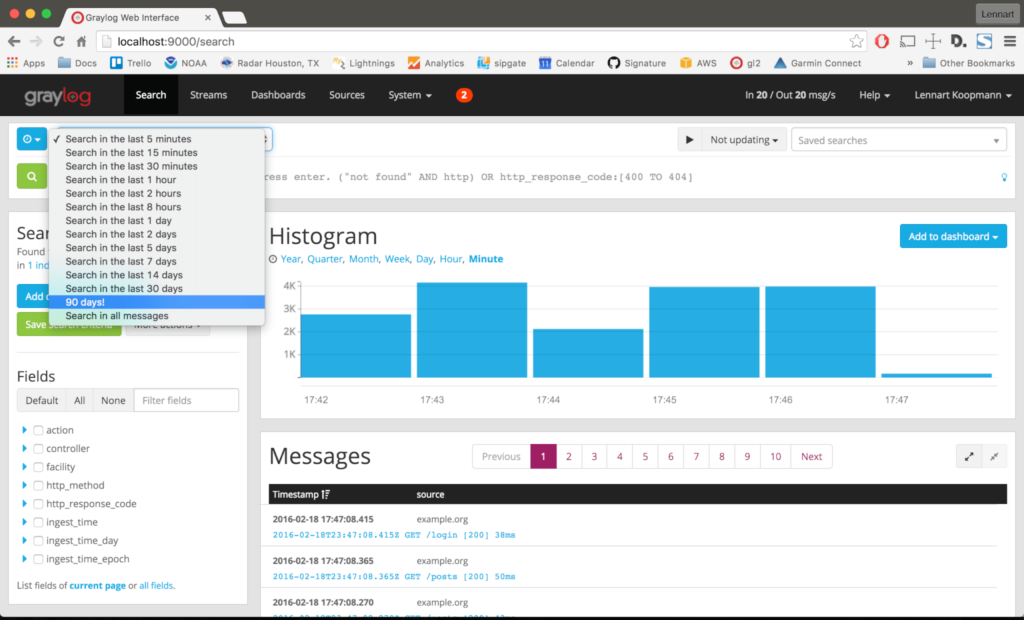
One of the systems competing with the ELK stack for collecting and processing logs is Graylog Open, which also uses Elasticsearch as a log storage and search engine. Graylog itself directly performs the functions of a log aggregator and visualization tool in the form of a client single-page browser application.
In terms of log aggregation, the Graylog functionality is very similar to the Logstash functionality:
- the ability to receive data in different formats from various sources using various input plugins,
- processing input data using so-called extractors, in which the rules for extracting the values of the desired named fields from message strings can be specified using regular expressions and grok patterns,
- sending processed structured logs to the Elasticsearch data storage system or, using special output plugins, to other systems,
- the ability to work with both simple text messages and events in JSON format .
Since Graylog uses Elasticsearch, it is similar to the ELK stack in terms of search queries and working with the data warehouse and index, and in terms of processing and visualizing data from log messages, the Graylog web interface provides functionality that is similar to Kibana.
Despite the significant similarity in the principles of operation and user functions between the ELK stack and Graylog, the latter has a number of features:
- additional mongoDB database to store configurations and settings,
- ability to create and combine multiple search queries into one action and view the results on a dashboard screen.
But the most important difference and advantage of Graylog Open over the ELK stack is the presence of a built-in notification system (alerts) in case of any specific situations or events in the process of collecting logs (there is a notification system in ELK, but it is paid, although there are also free third-party plugins with similar functionality).
Graylog Alerts are periodically self-triggered search queries that can send notifications if certain conditions are met as a result of the query. Graylog allows you to set a variety of alert conditions based on the data it collects, the following are available by default (for others, you need to install plugins):
- the filter condition is triggered when at least one message arrives in the specified stream, in which a specific field contains the specified value,
- the aggregation condition is triggered when the result of the aggregation (usually a counter of the values of some fields) exceeds a certain threshold value.
Notifications can be sent via email or http to any configured recipient.
Graylog, as well as the latest versions of Elastic, provides the ability to install its agents on each controlled system (Graylog Collector Sidecars), which collect the necessary information and send it to the server.
Using a separate Graylog panel Sidecars in the web interface, you can centrally manage and maintain a consistent configuration of various logging agents on all nodes. For this, a system of tags is used, which are created through the web console and contain configurations for collecting a certain type of logs (for example, Apache logs, DNS logs, etc.), and Sidecar agents on specific machines can “self-configure” by the specified tag and start sending data.
3. Acure
Acure platform is a freemium solution for log monitoring and AIOps. There are no restrictions on the number of users, events or automation rules and up to 5 GB of daily incoming data. Although Acure is still a very young product, in terms of functionality it can compete with well-established log monitoring tools like the ELK stack, since it has all the necessary elements to organize a data collection and processing system.
As a log message aggregator, Acure can perform the following functions:
- receiving data in JSON format from various sources via http and many connection templates (Zabbix , Prometheus , Nagios, Ntopng , SCOM, etc.);
- its own low-code engine for processing of input data: extracting named field values from message text using regular expressions, transformation and change of field values, adding new fields and their values (enriching data with new labels);
- storage of logs in ClickHouse database;
- management of user access rights to configurations and settings of data flows.
Acure uses the ClickHouse DBMS as a data store, as well as search and analytical engines, which gives it the following functionality:
- sending search queries (with a syntax similar to Lucene) and all kinds of filtering of the results,
- column type of the ClickHouse database provides very fast processing of search and analytical queries (lack of indexing),
- the model for the database is generated automatically based on the JSON model of a particular stream, the necessary fields are added if it’s required.
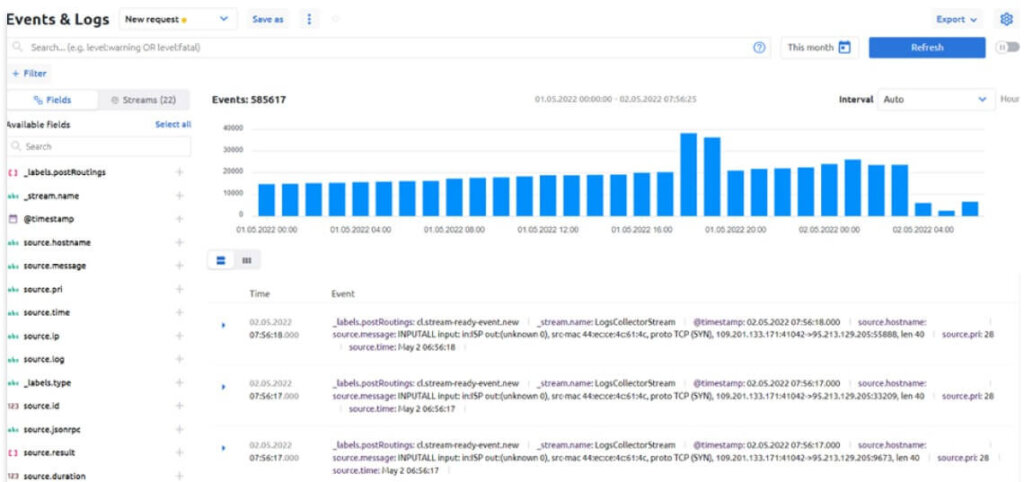
In terms of data visualization, Acure has the following functionality:
- displaying the total number of processed events as a time series histogram;
- representation of the values of various fields in the form of a histogram of frequency (for numeric fields, the minimum, maximum and average value are also calculated);
- support for Markdown markup in displaying the text of log messages (you can write your own handler that will add Markdown markup to the required fields);
- visual filter constructor with the ability to include and exclude specific field values in the filter by clicking on them.
In addition to the standard presentation of raw log and event data, there are also more specific visual components:
- timeline for events and work planning (this is convenient when you need to share a schedule of important events, routine maintenance or marketing activities with colleagues, and also on the timeline you can investigate the root cause of the incident and correlate by the time of the event);
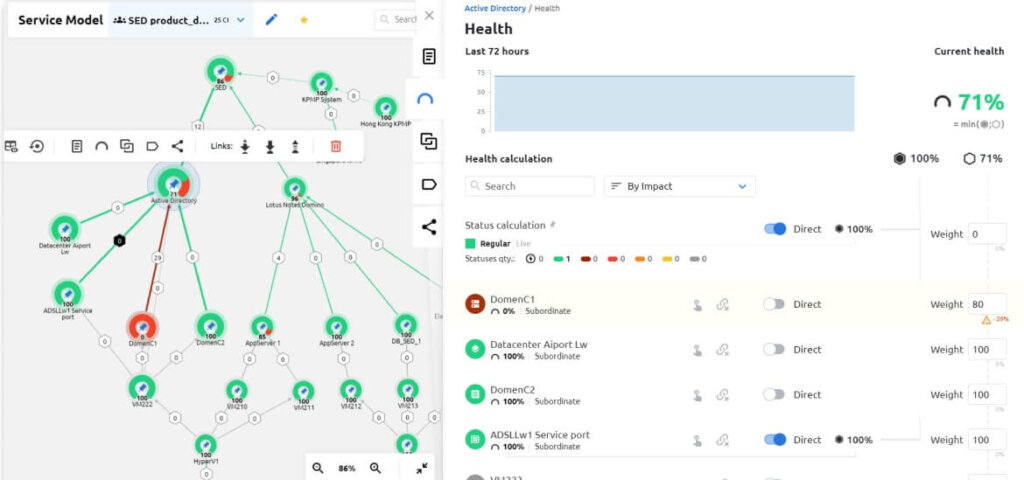
- heat map of the state of the selected set of services and monitoring objects;
- topology graph with the states of individual objects and the transfer of health statuses with the formation of the health of these objects;
- other screens for more specific tasks, such as SLA calculation and business impact analysis.
Acure also has a notification system that works on the same principles as Graylog or Splunk, there is a synthetic trigger mechanism for generating events, and a “Rules and Actions” mechanism for triggering the necessary actions to trigger complex rules.
4. Grafana Loki
Grafana Loki is a relatively recent addition to the list of log monitoring tools and analysis software solutions – the project was launched in 2018. Grafana Loki works in the same way as the ELK stack and Graylog, but with its own specifics.
Loki itself is nothing more than an indexer of the structured logs it receives and indexing is not carried out according to the entire text of log messages, only according to log metadata (tags or labels), while the logs themselves are compressed side by side into separate files and stored either locally, or in cloud storage like Amazon S3 or GCS. Full-text search by index is not possible in Loki.
The data is searched first by indexed fields and then the text of the selected logs is scanned with regular expressions. This approach avoids problems with RAM requirements (a full-text index of logs is often comparable in size to the logs themselves, and for a quick search it must be loaded into memory), but it significantly increases the search time in case of a large volume of logs.
To speed up the search, Loki can split the request into several parts and execute them in parallel, so that the processing speed depends on the allocated resources.
Secondly, Loki delegates all the main work (parsing, finding named fields in the text of log messages, their transformation and reduction to a common format) to collector agents. Loki ‘s native agent is Promtail, although it is possible to use Fluentd, Logstash and some others.
Currently, Promtail can only read log messages from local files and from the systemd service, but it borrows Prometheus ‘s service discovery mechanism, which allows it to automatically integrate with Kubernetes and collect logs from nodes, services, or pods, immediately putting tags on based on metadata from Kubernetes .
The mechanism for processing log messages and bringing them to a structured form in Promtail is similar to the mechanism of extractors in Graylog (although there are some nuances everywhere), but Promtail does not have a graphical interface and the entire configuration of processing pipelines must be specified separately in a text file, which is not always convenient.
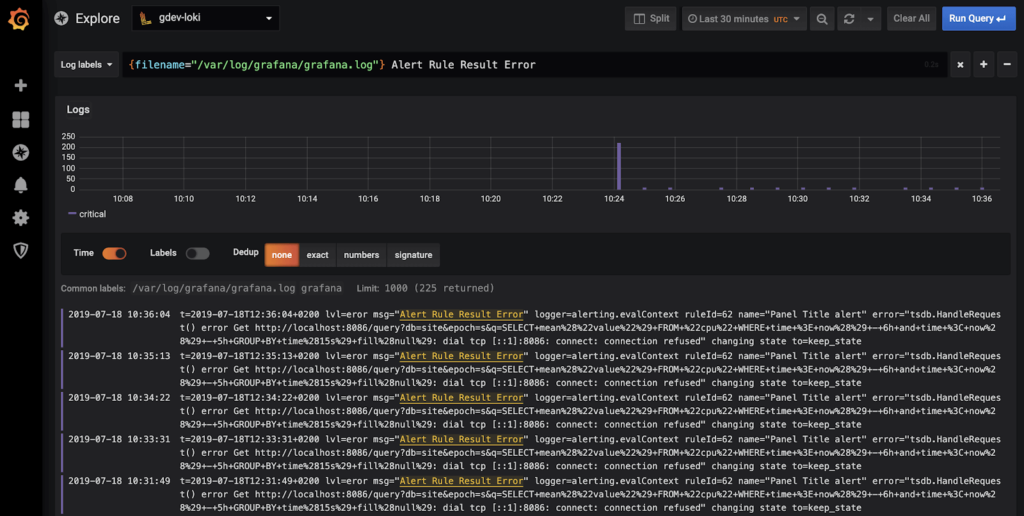
A tool for visualizing data from logs in the Grafana system Loki performs, of course, Grafana . Search queries in Loki can be sent in a special Grafana interface Explore, queries use LogQL very similar to Prometheus PromQL . Like Kibana, Grafana provides a wide range of data visualization options:
- search query results can be displayed in the form of various graphs, histograms, tables, heat maps, etc.,
- it is possible to combine several visualizations on one dashboard, which can be saved, loaded and modified, as well as exported and imported from Grafana.com.
Grafana has a highly developed built-in alert system, which, similar to Graylog, are periodically self- launched search queries that generate notifications when certain conditions are met. At the same time, the options for configuring and setting up alerts provided in the Grafana graphical interface are very wide, and notifications can be sent through many channels: email, slack, telegram, discord, etc.
Instead of a conclusion…
For all the considered log monitoring tools in the latest versions, it should be noted a strong trend towards delegating the functionality of the primary processing of logs to their local agents, which can lead to some simplification of the functionality of log aggregators. It is also worth noting the trend of a gradual reduction in free functionality and the emergence of more and more paid ones.
This applies to ELK and Graylog. ELK stack is one of the most complete log monitoring tools for collecting and processing data but alerting only in paid versions significantly spoils the picture. Graylog is also more of a log analysis tool. Grafana Loki is one of the simplest and lightest log monitoring tools, and it is suitable for solving narrow problems when full observability of systems and services is not needed.
Acure, despite being a young platform, is significantly superior in functionality to the presented log monitoring tools and provides full observability and powerful functionality absolutely for free.