A Single System for Automated IT Operations

Data from various systems is fragmented, leading to complex monitoring:
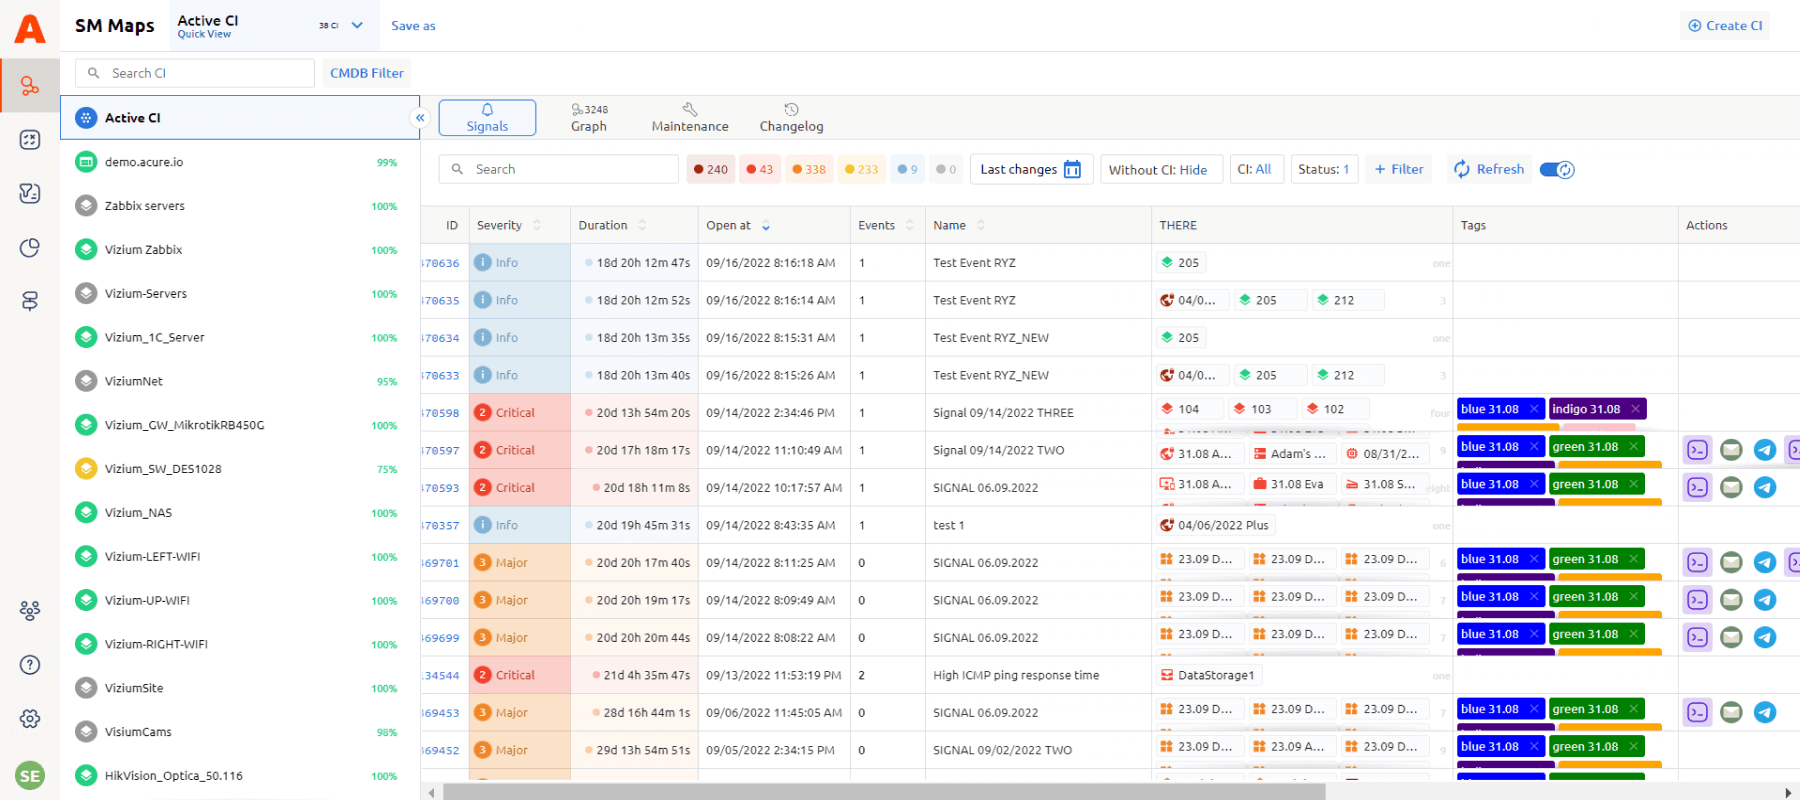
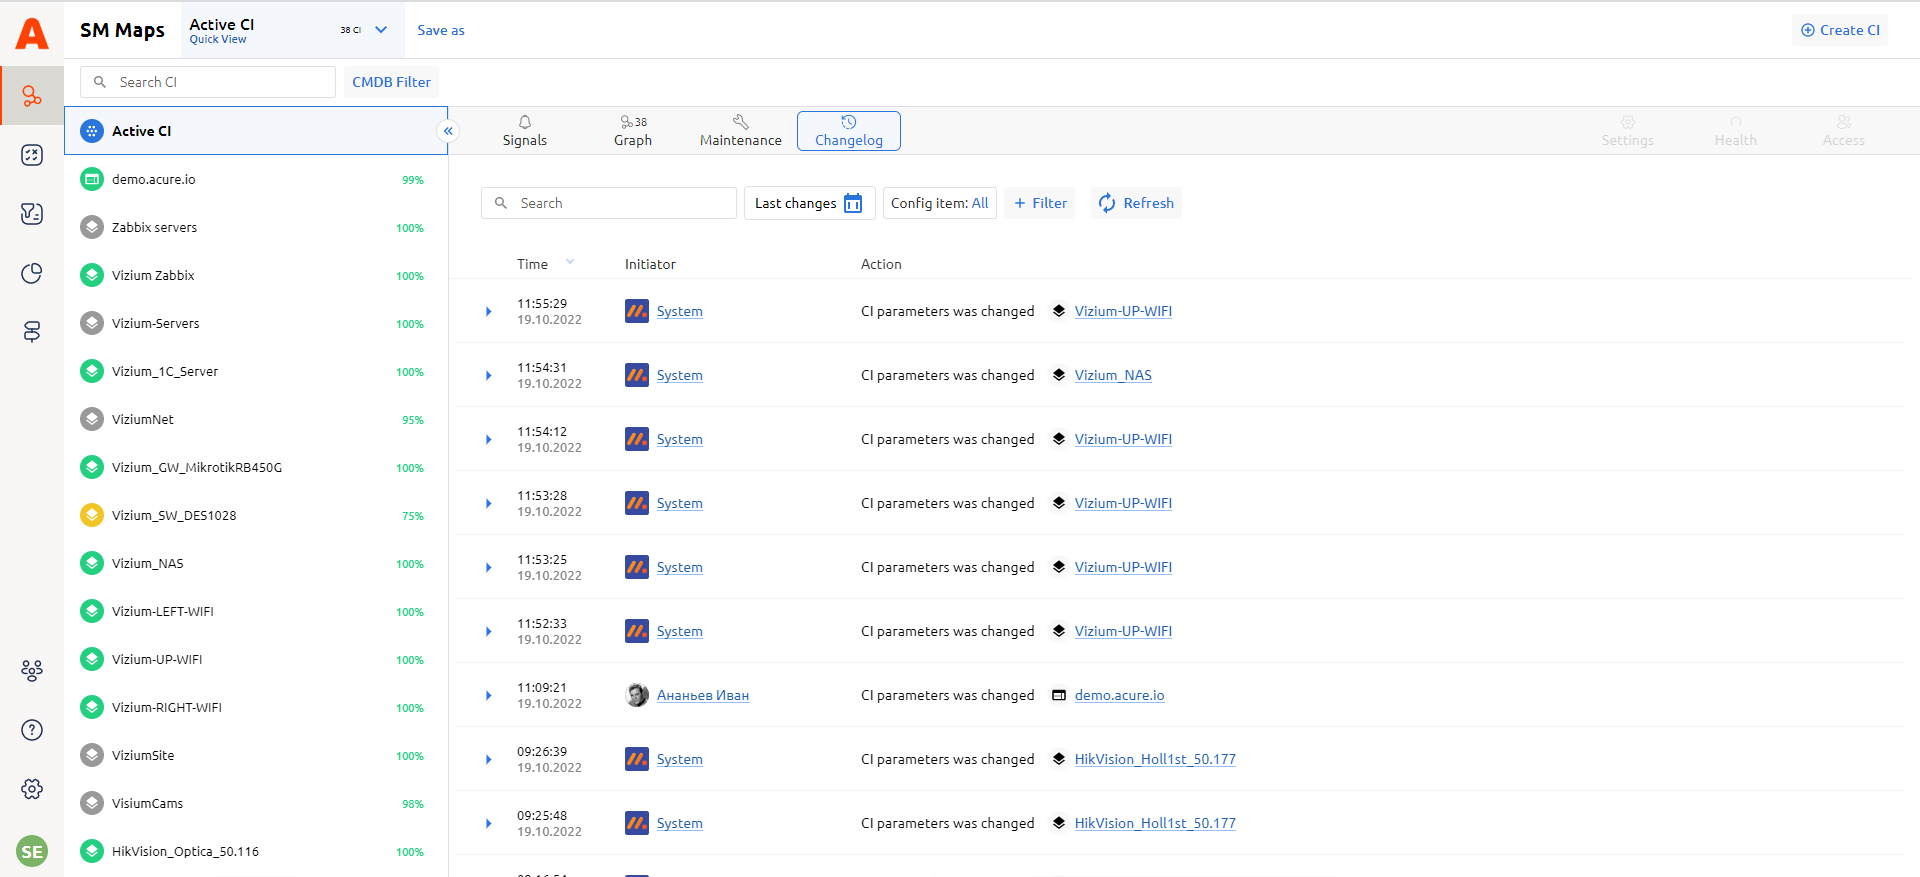
For monitoring to become effective, it is important to see all alerts on one screen. Moreover, a significant point is also the ability to track not only the incidents, but also the history of their elimination to prevent these problems in the future.
One-screen IT state visualization is essential:
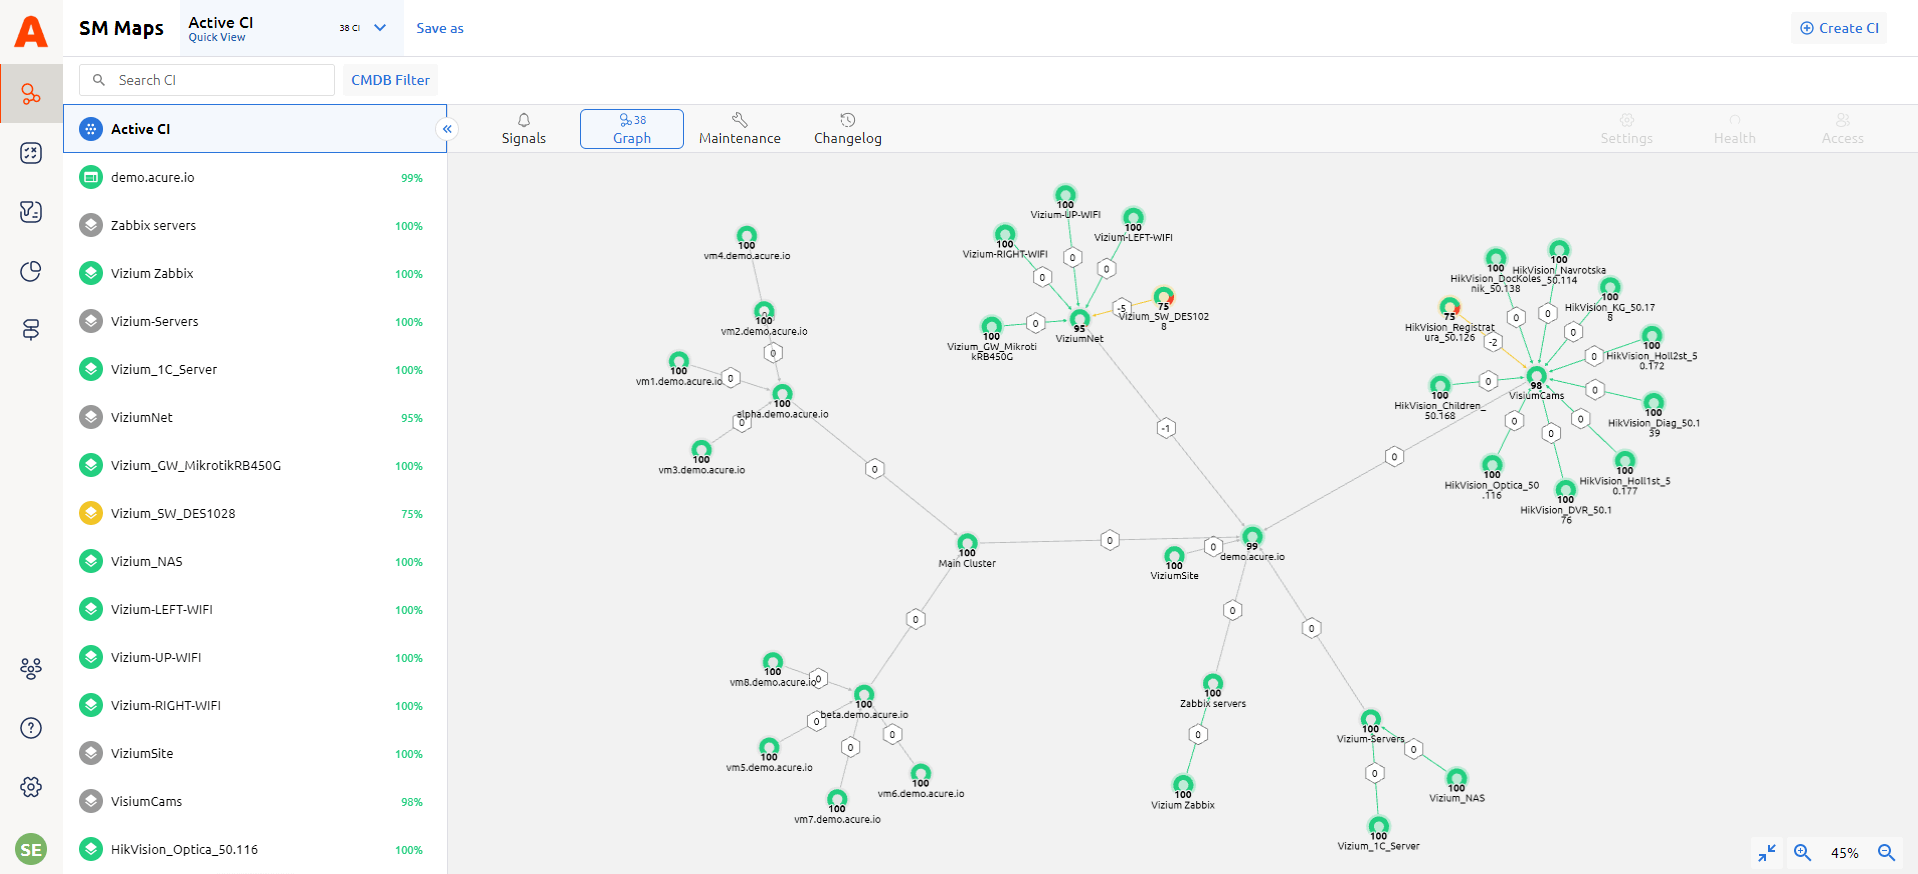
A unified view, correlations between events, logs and messages, general storage and display settings — in Acure you can find everything for comfortable work with data on one screen.
It is an indispensable tool to control IT and promptly resolve all incidents. Not only to track but in preventing issues also.
How does it work?
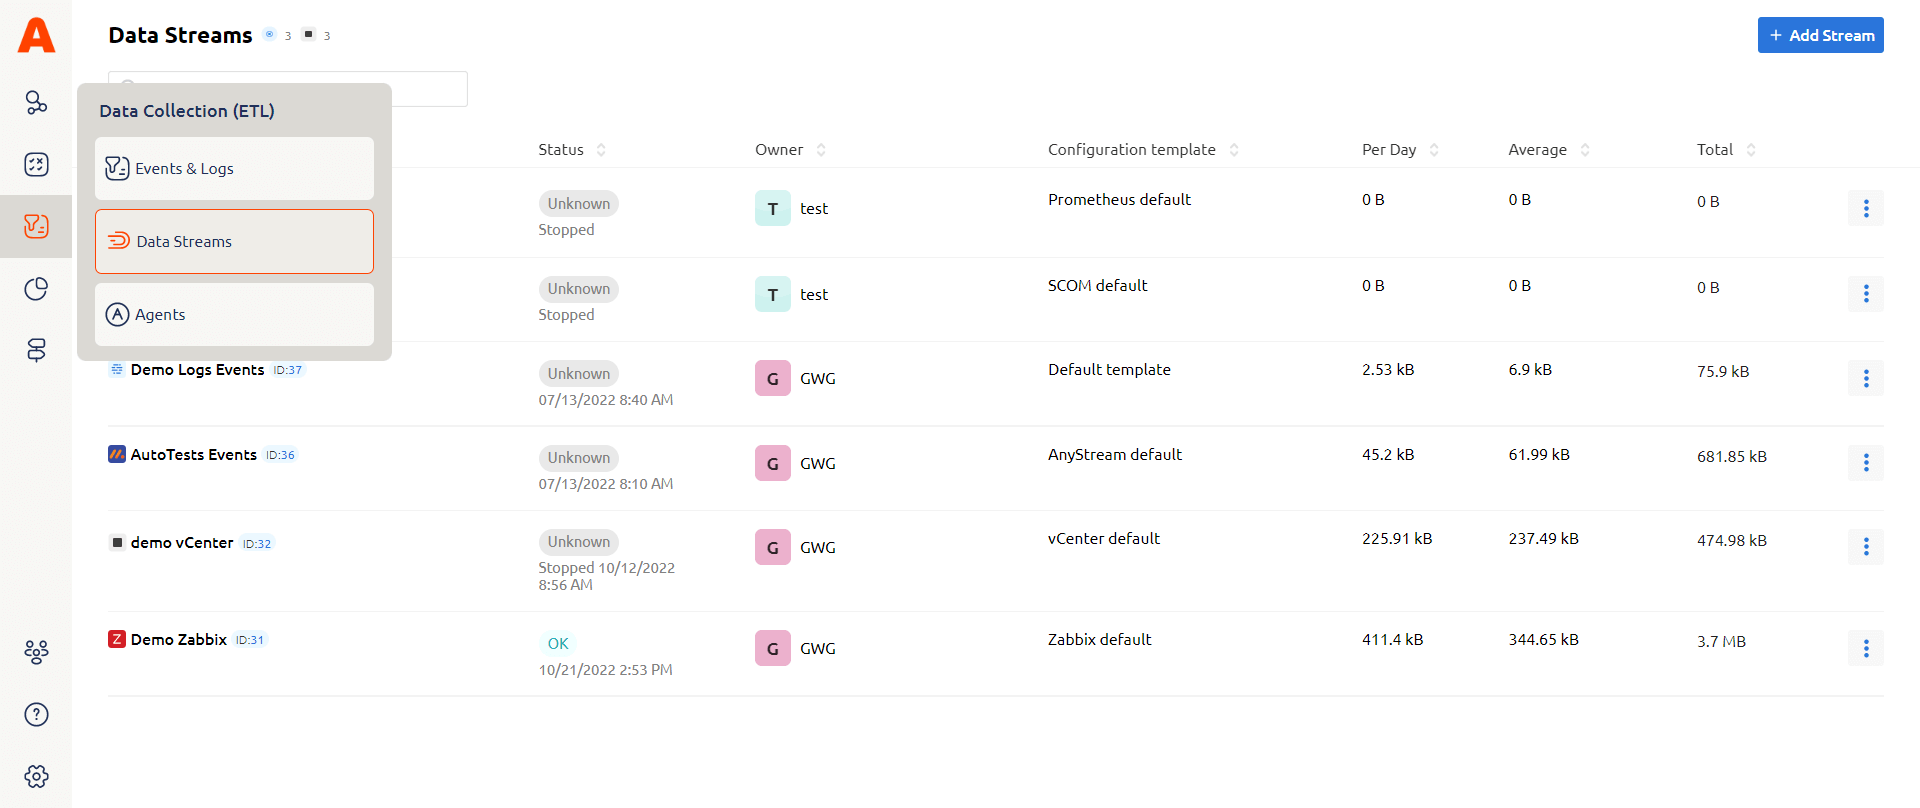
1. To see all data in Acure first connect Data Streams. Utilize the connector for existing systems or create custom connectors for the systems that don’t exist in Acure. Write the tasks for integration and start the collection of data.
2. After collecting the data and the correlation setup, you can see the status of the entire IT complex on a single screen where you can switch between different modes. In the left panel there is a list of filtered CIs, their health and status; in the right panel the information changes depending on the selected mode by the operator: Service Model graph, CI cards, list of Signals, Maintenance and Changelog.
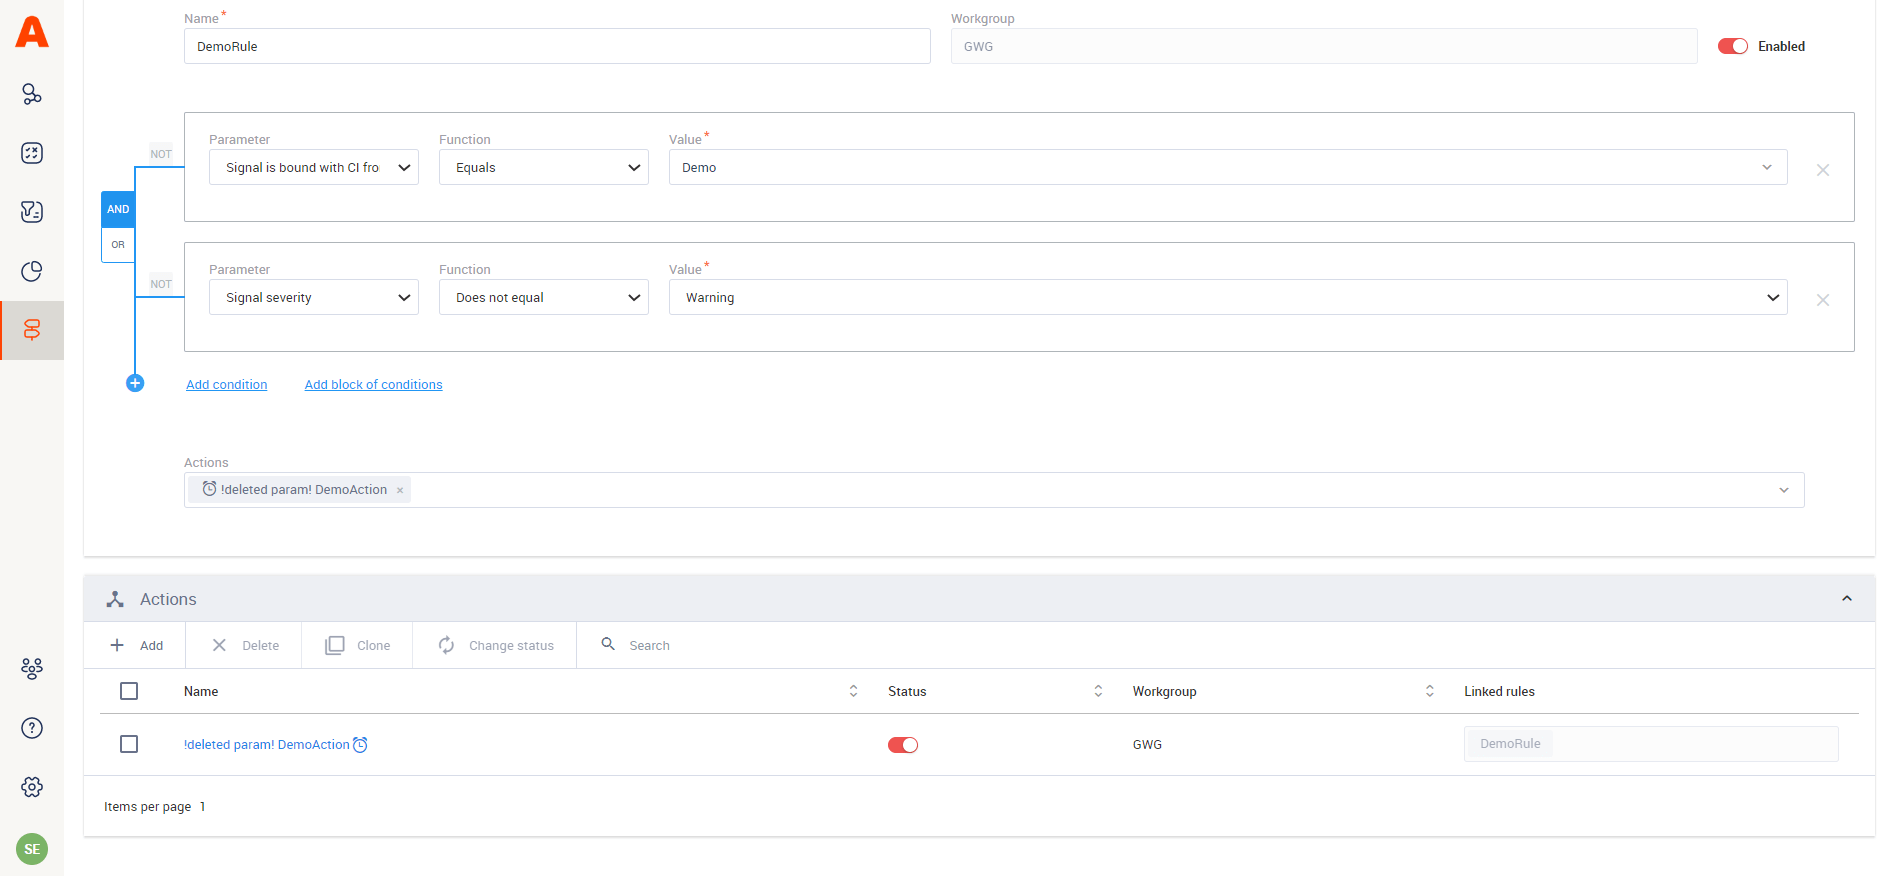
3. To prevent the solved problems reoccurring in the future, the rules and behaviour of the system for this type of incident can be configured in the Rules & Actions section. The actions (scripts, notifications) can be customized simultaneously for all CIs, from all systems, without any complex programming.
