Understanding Kubernetes Observability
Kubernetes observability encompasses the collection, analysis, and visualization of a Kubernetes cluster’s internal processes. It empowers developers and operators to:
- Swiftly identify and diagnose issues
- Optimize resource utilization and performance
- Boost application scalability and reliability
- Maintain high security and compliance standards
Essential Data Types for Kubernetes Observability
- Metrics: Numeric data representations used to gauge your Kubernetes cluster’s performance. Metrics can be collected using tools such as Prometheus or Datadog.
- Logs: Detailed event records within your cluster, essential for troubleshooting and pinpointing potential issues. Common log management tools include Fluentd, Elasticsearch, and Logstash.
- Traces: Tracing tracks request flows and communication between services in distributed systems. Jaeger, Zipkin, and OpenTracing are popular distributed tracing tools.
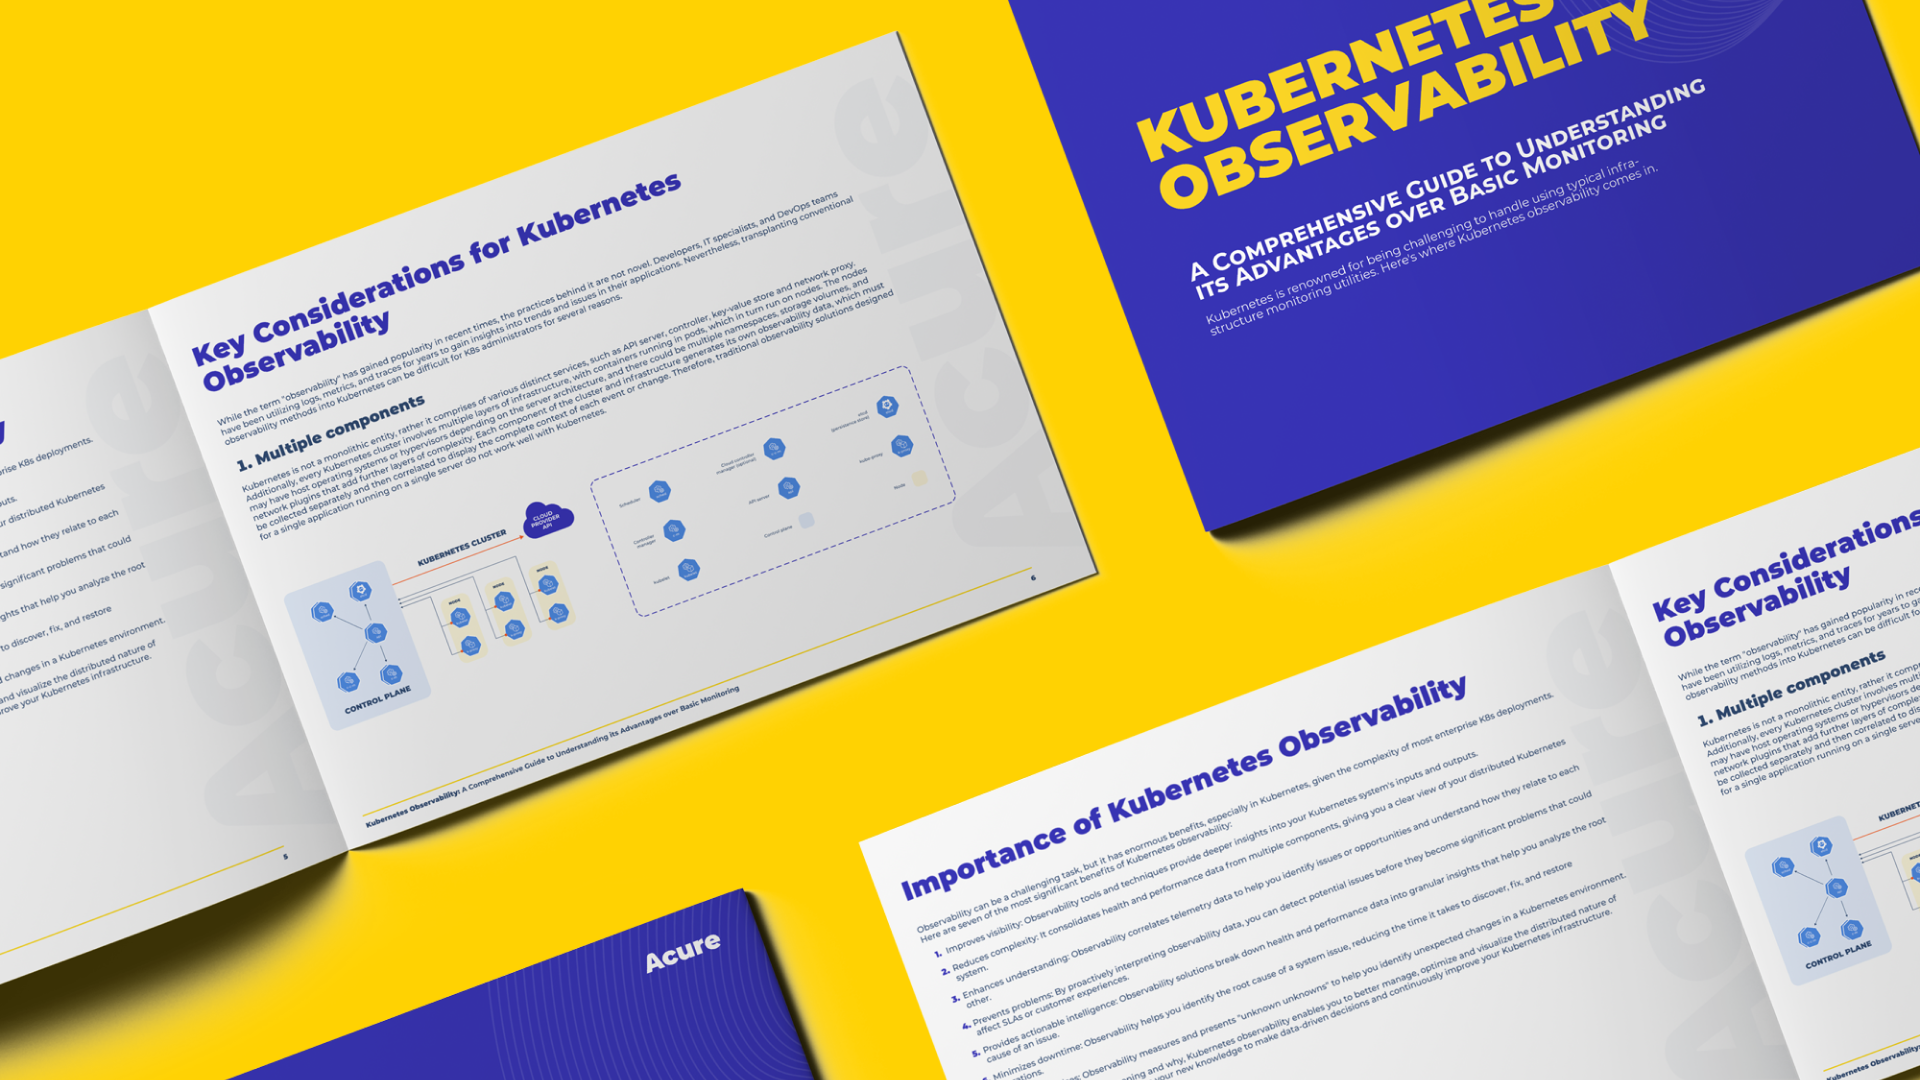
🎯 5 Reasons to Download Our Kubernetes Observability Guide

Take control of your Kubernetes environment! Gain valuable insights on:
- Logs, metrics & tracing
- Managing complex Kubernetes cluster
- Leveraging popular observability tools
- Practical implementation tips
- Best practices for success
✔️ Learn with DevOps pros and download the guide!
Introducing Acure: The Unified Observability Platform
Acure is a versatile observability platform tailored for monitoring Kubernetes, AWS, Azure, GCP, and more. It offers an integrated solution for monitoring, logging, and tracing, enabling users to access metrics, events, and logs from a single location. Acure’s AIOps capabilities facilitate rapid incident identification and resolution, enhancing productivity and minimizing downtime. With Acure, you can eliminate the need for separate tools for monitoring observability.
Key Acure Features:
- Centralized dashboard: Acure’s unified dashboard consolidates metrics, logs, and traces for streamlined monitoring and troubleshooting of Kubernetes clusters.
- Real-time alerting: Acure’s customizable alerting system allows notifications to be sent through your preferred channels, enabling prompt responses to potential issues.
- AI-driven insights: Acure leverages artificial intelligence and machine learning for deeper insights into your cluster’s performance, facilitating resource optimization and cost reduction.
- Seamless integration: Acure effortlessly integrates with your existing Kubernetes infrastructure for a smooth transition to this comprehensive observability solution.
Monitoring with Prometheus, Grafana, and Acure
Prometheus, an open-source monitoring tool, is often paired with Grafana, a visualization platform, to monitor Kubernetes clusters effectively. Acure enhances this combination by seamlessly integrating with these tools and providing a unified dashboard for metrics, logs, and traces, making it easier to analyze your cluster’s health and set up real-time alerts.
⭐ Get Signal from the Noise: Kubernetes Observability vs. Monitoring Workshop
Join us on April 26 for 2 hours of engaging and informative sessions, where we will dive deep into the world of Kubernetes observability and monitoring.
The event will feature a keynote talk by a renowned expert in the field, who will provide insights into the latest trends and best practices for Kubernetes observability. Following the keynote, we will have a panel discussion with real-life cases from the audience, where experts will share their experiences and best practices for addressing common challenges in Kubernetes monitoring and observability.
✔️ Register now and save your seat!
Logging with Elasticsearch, Fluentd, Kibana (EFK Stack), and Acure
The EFK stack is a popular choice for Kubernetes log management. Fluentd collects and processes logs, Elasticsearch stores and indexes the data, and Kibana provides a powerful visualization and querying interface. Acure complements the EFK stack by offering a centralized platform to visualize and analyze logs alongside metrics and traces, ensuring a comprehensive and efficient approach to log management.
Tracing with Jaeger, Zipkin, and Acure
Distributed tracing is essential for enhancing Kubernetes observability. Jaeger and Zipkin are both open-source tracing systems with powerful features to trace requests and communications between microservices in your Kubernetes cluster. Acure streamlines the process by integrating with these tracing systems and presenting traces in a unified dashboard, making it easier to monitor and troubleshoot your cluster’s performance.
***
Mastering Kubernetes observability is crucial for ensuring the smooth operation of containerized applications. By leveraging Acure, an all-in-one observability platform, you can gain valuable insights into your cluster’s performance and optimize your applications for maximum efficiency and reliability. Say goodbye to the hassle of using separate tools for Kubernetes observability – Acure has got you covered. Embrace a proactive approach to Kubernetes observability by implementing best practices with Acure’s advanced features.

