The Importance of Data Observability
The use of data observability is becoming increasingly important as organizations strive to gain analytical insights from their data. By proactively looking at the data they have available, companies are able to identify trends and issues that could be critical in making decisions and shaping strategies. With accurate and timely observations based on collected data, organizations can quickly detect problems before they become bigger issues, minimizing risk and potential costs.
Additionally, organizations can also use observability techniques to observe how existing systems perform and make necessary adjustments, ensuring that processes are always running smoothly and efficiently. Data observability tools give an organization the ability to make quick adjustments to provide better services for customers or develop more products and services for new markets. Ultimately, investing in a good data observability toolset pays off by allowing organizations to optimize their performance in the long run.
In one of our previous articles, we compared the concepts of observability and monitoring. Although they have some differences, they also share some similarities – for example, the instruments of realization.
How to Choose the Right Observability Tool
Choosing the right observability tools can be an overwhelming task You need to assess different factors such as cost, ease of use, security and compliance issues, data retention length and customizations.

Does the tool provide a generous free plan and pricing based on usage? Is it easy to set up and learn? What integrations are available with existing tools? You should also consider if the tool provides scalability in order to handle larger datasets. Lastly, you will want to think about how much data you want to retain and for how long. Assessing each of these features is key when selecting an observational platform for data.
We hope this article will help you with your choice, because in it we have collected the best full-stack observability tools that you should pay attention to in the new year, based on their main advantages and features.
Best Observability Tools
Datadog
Datadog is an application performance monitoring solution that helps organizations monitor and troubleshoot their systems. It collects data from applications, servers and other infrastructure components to provide real-time insight into the health of the system. Datadog also provides tools for creating alerting rules, custom dashboards and automated reports. With these features, customers can quickly identify issues before they become problems and take corrective action in a timely manner. Additionally, Datadog allows customers to customize their setup with plug-ins or scripts written in Python or Golang. This makes it easy to extend the platform’s functionality to capture data not already supported by Datadog out of the box.
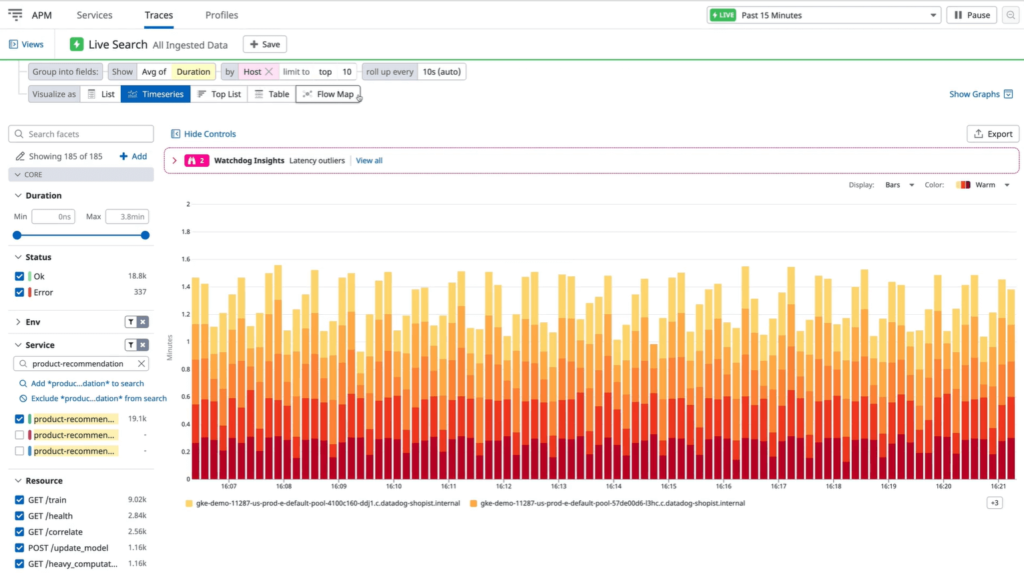
Overall, Datadog is a comprehensive monitoring and troubleshooting solution for organizations of all sizes. Its breadth of features makes it an excellent choice for both small businesses and large enterprises. Datadog’s ability to collect data from multiple sources, its robust alerting capabilities and its ability to be extended with custom scripts make it a great choice for those looking to maximize performance while minimizing operational costs.
Most liked features:
- Unlimited integrations
- Frequent releases and stability
- Dashboards available from the get-go
Splunk Observability
Splunk Observability provides an end-to-end observability platform that helps you quickly identify, investigate and troubleshoot issues with your applications. With powerful data search and analysis capabilities, it enables teams to gain real-time insights and visibility into the performance of their systems. The platform comes with various tools for building custom dashboards, visualizations, alerting mechanisms and more for proactive monitoring of system health and performance. It also features built-in ML models to help identify potential areas of improvement or detect anomalies in your data.

Splunk Observability’s intuitive user interface makes it easy to navigate through the platform so you can focus on quickly diagnosing any issues. Additionally, its robust security model helps ensure that all your data is protected and private, reducing the risk of unauthorized access.
Furthermore, Splunk’s global support network helps ensure that technical issues are resolved in a timely manner. All in all, Splunk Observability is the perfect tool for any team looking to gain real-time insights into their application performance.
Most liked features:
- Works well with high volumes of data
- Built-in dashboards
- Customized reports
Acure.io
Acure.io is a self-hosted topology-based AIOps platform for observability and automated remediation. It is a fully SaaS solution with a flexible and open architecture that includes quick and easy tools to find the root cause by topology, time and context with business impact and to aggregate and process any data from any system in a single place. Acure allows you to build and manage CMDB with the low-code engine, visualize the state of the entire IT, run automation from one system for all purposes and quickly and cost-effectively put any application on performance monitoring.
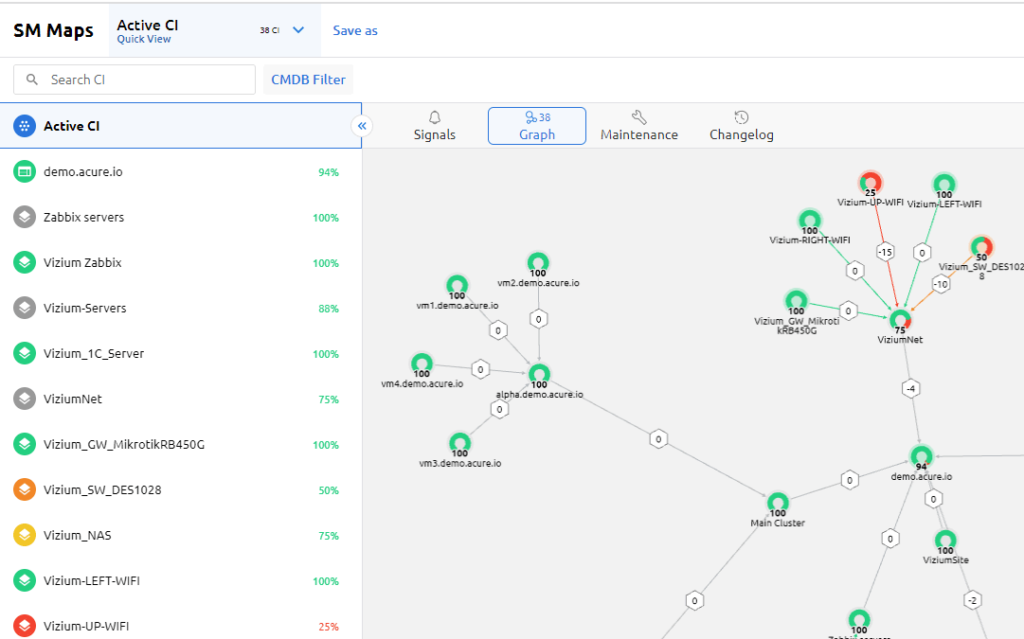
Acure aggregates, normalizes and enriches events collected from various monitoring tools You can connect and extract data from various sources including other popular monitoring systems using ready-made configuration templates and plugins or your own tasks.
Acure uses low-code scenarios to correlate alerts into actionable insights – Signals. IT operation teams can detect incidents before they become failures.
Acure provides rapid identification of the root cause of an incident. This includes mapping the impact of various technical resources on business services, identifying service and infrastructure changes that cause incidents and highlighting possible bottlenecks.
The dependency map is built automatically based on data from your existing monitoring systems and other tools. This is vital for dynamic environments, such as modern cloud ecosystems and microservices on Kubernetes.
Acure optimizes incident response through the automation of grouping incidents into Signals, two-way ticketing, notifications and chat creation. Running built-in scripted automation tools with low-code and external runbooks allows workflows to be automated for faster incident response.
Most liked features:
- Ready-made templates for different integrations
- Single dependency map of the whole IT infrastructure, event correlation and noise reduction
- Automation engine
- Rich functionality of the free version
Dynatrace
Dynatrace is a comprehensive, full-stack monitoring platform that enables DevOps and IT operations teams to rapidly detect and triage performance issues. It offers services such as application performance management (APM), infrastructure performance monitoring, log analytics, AI-powered automation and more. The platform helps organizations reduce costs, improve customer experience, streamline processes and stay ahead of the competition.

The platform uses artificial intelligence (AI) and machine learning (ML) to automatically detect issues in your environment before they become major problems. Dynatrace also provides an automated root cause analysis engine which quickly points out the source of these problems so you can minimize downtime and get back on track faster.
Its strong observability capabilities come from its distributed tracing technology that helps you monitor your applications across multiple environments and technologies. Having this visibility, Dynatrace can quickly detect issues in complex architectures to keep your infrastructure running smoothly.
Dynatrace also offers advanced analytics tools that provide insights into customer journeys, application performance optimization opportunities and more. This data can be used to make informed decisions about how to optimize the user’s experience and improve overall efficiency. Furthermore, Dynatrace uses AI-assisted automation to streamline manual processes such as incident management; this optimizes resolution time so you can spend less time troubleshooting and more time innovating.
Most liked features:
- Synthetic monitoring
- AI engine
- Real-time alerts
New Relic
New Relic is a SaaS platform that provides users with the tools and insights to monitor their applications, websites, and digital operations. The platform offers customers real-time data analytics, alerting and monitoring capabilities to ensure the optimal performance of their systems. Additionally, New Relic provides deep visibility into customer architectures to identify root cause issues quickly and accurately.
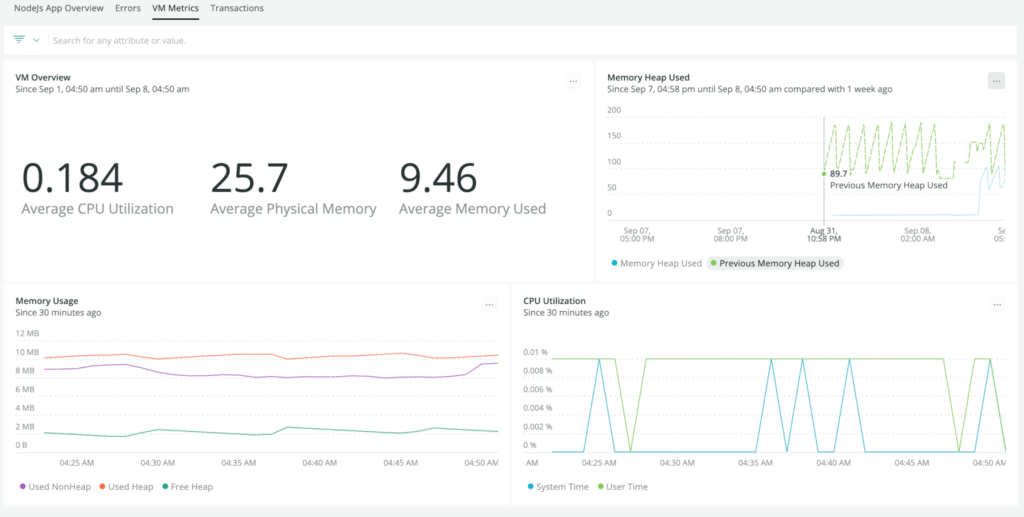
This allows organizations of all sizes to gain valuable insights into application health as well as user experience metrics such as response time, errors per minute, throughput rates, and more. This can be used to provide feedback on how well an organization’s products perform or detect potential problems before they become a problem for customers.
Moreover, New Relic simplifies the process of managing and monitoring large distributed applications across different cloud environments. It also provides an integrated platform for operations teams to quickly identify, fix and prevent incidents within their environments. This gives organizations the visibility and control they need to improve service availability, thereby boosting customer satisfaction. Additionally, New Relic integrates with other popular business applications such as Terraform, Ansible, and Kubernetes to provide a comprehensive toolkit for automation and analytics.
Most liked features:
- Based on OpenTelemetry standards
- Over 470 available integrations
- AI for incident detection and alerting
Grafana Cloud
Grafana Cloud is a platform for monitoring cloud-based applications and ensuring optimal performance. It includes a query editor, dashboard builder and alert system to ensure the right information is available at the right time.

Grafana Cloud also offers advanced alerting capabilities that monitor metrics and send alerts when something is out of the ordinary. Users can set up alerts for specific conditions such as anomalies, thresholds or other issues that might occur in their environment. Teams can quickly set up dashboards and alerts from their data sources to get insight into their systems. This includes monitoring common metrics such as system health, log analysis for troubleshooting and performance optimization. With Grafana Cloud’s query editor, users can access a wide range of queries to help them easily visualize their data.
Additionally, Grafana Cloud includes integration with popular services such as PagerDuty, Slack and VictorOps to ensure teams are notified quickly when an issue occurs.
The platform also enables secure collaboration between teams by allowing them to easily share insights with colleagues.
Most liked features:
- Free-tier with easy setup
- Fast building and delivering new features
- Informative dashboards
- Perfect for time-series graphs
Elastic Observability
Elastic Observability is an open-source platform for monitoring and managing application performance, resource utilization, security threats and other system metrics. It enables organizations to observe their entire application or environment and provides visibility into the health of their systems. The platform collects data from multiple sources such as application logs, metrics, traces, audit logs and other services to give users a holistic view of their infrastructure. By providing insight into system performance in real-time, Elastic Observability allows users to quickly identify problems before they become costly outages.
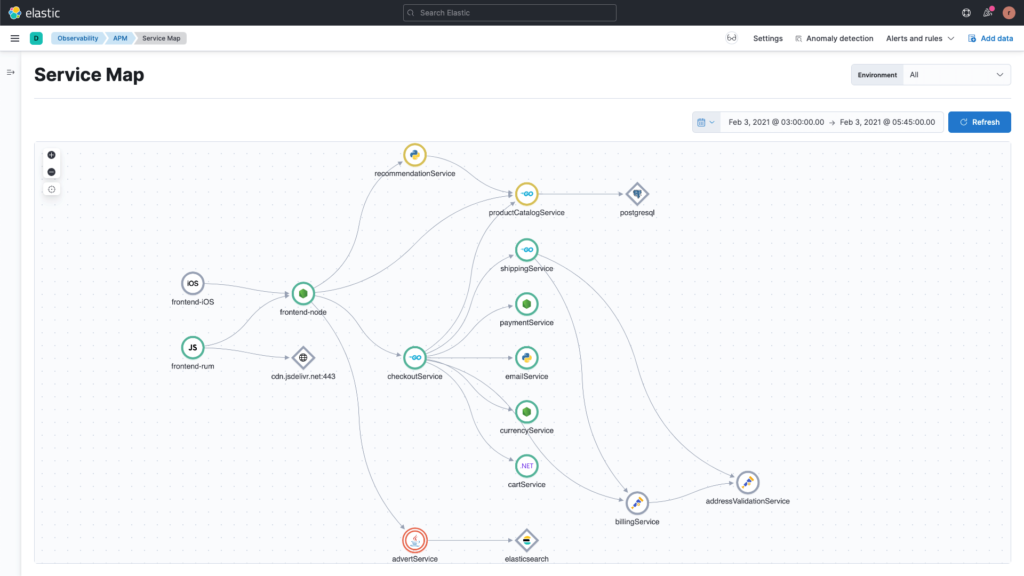
The platform includes a range of features that make it easy to monitor your environment and application performance. Its intuitive user interface makes the process of setting up and configuring Elastic Observability simple. Additionally, the platform uses distributed tracing and anomaly detection to help users identify issues quickly. It also offers detailed analytics, alerting capabilities, custom dashboards, and reporting tools to provide visibility into application performance.
Most liked features:
- Quick search
- The possibility to link logs and traces
- APM and log correlation
Lightstep
Lightstep is a monitoring and observability platform designed to help software teams discover, diagnose and resolve issues in real-time. With its powerful distributed tracing capabilities, Lightstep can trace transactions across multiple services, provide insights into system performance and user experience, and quickly detect anomalies that may indicate potential problems. This helps software teams stay informed of the health and performance of their applications as they continuously release new products or features. The platform also provides a unified view of system-level metrics alongside custom application data, allowing developers to easily troubleshoot errors and identify performance bottlenecks.

Lightstep’s modern architecture is built for scalability and resilience, with multi-tenancy support for large-scale deployments. Its open-source agent and cloud SDKs are lightweight and easy to use, enabling customers to quickly implement distributed tracing across their infrastructure. Lightstep is also compatible with popular third-party services such as Kubernetes, New Relic Insights, and Splunk. This allows customers to combine data from multiple sources into a single unified view for deeper insights into their operations.
Most liked features:
- Simple and intuitive interface
- High standard of service support, clear documentation
- Contribution to OpenTelemetry
AppDynamics by Cisco
AppDynamics by Cisco provides an agent-based platform for monitoring and optimizing business applications. It helps identify performance issues, diagnose root causes of outages, and ensure that application code is running smoothly. AppDynamics’ features include real-time analytics, automatic diagnostics, and flexibility to customize the deployment across cloud environments.

With this solution, organizations can track every transaction from end-to-end across distributed systems using automatic tracing technology called “Business Transactions”. This feature enables quick identification of potential problems while providing insights into user experience based on snapshot views of data at any given time. In addition, AppDynamics also offers a range of products such as Server Visibility Tools to help monitor application infrastructure, and Business iQ which provides business-level application performance metrics.
Using AppDynamics’ agentless architecture, detailed data can be collected from applications running in public clouds as well as private on-premise systems. This enables a unified monitoring approach that can identify anomalies and detect problems across different application components. The platform also includes advanced analytics such as anomaly detection to quickly pinpoint issues, code-level diagnostics for identifying root cause of the issue, and machine learning algorithms for automating issue resolution. These capabilities make it easier for businesses to proactively manage their application performance and availability.
Finally, AppDynamics by Cisco comes with integrated security features such as user authentication and authorization so organizations can protect their IT environment while also keeping their performance data secure.
Most liked features:
- Integrating business and technology metrics
- Consolidated observability, anomaly detection and root cause analysis
- Alerts with useful custom actions
Chronosphere
Chronosphere is a powerful tool for managing large-scale distributed systems. It provides an intuitive visual interface that simplifies the deployment, operation, and monitoring of multi-node systems. By leveraging the power of cloud computing and container orchestration technologies, Chronosphere enables organizations to quickly deploy highly available infrastructure with minimal effort.

Chronosphere is designed to provide scalability and fault tolerance across multiple nodes and data centers. For example, it can be used to efficiently scale up or down resources based on service demand while maintaining high availability in production environments. The platform also includes sophisticated alerting features to ensure rapid response when problems arise. This helps reduce downtime and ensures that services remain responsive despite heavy workloads or unexpected outages.
In addition to its scalability and fault tolerance features, Chronosphere also provides a range of other powerful tools for managing distributed systems. These include cost optimization tools to reduce operational costs, as well as monitoring tools for tracking system performance. The platform’s analytics capabilities make it easy to identify areas of improvement and uncover potential issues before they become major problems.
Most liked features:
- PromQL function suggestions
- Solving the Prometheus scaling problem
- Customer support and onboarding process
***
Observability is a key pillar of modern data management and selecting the right tools to ensure the highest levels of performance is an important decision. With the rise of cloud-native technologies, the number of observability tools available has grown exponentially.
Utilizing the correct observability tools can have a tangible impact on key business metrics and make downtimes easier to manage. Many of these observability tools offer free or low-cost plans that bring tremendous value with minimal effort. Therefore, it is worthwhile to look closer at the observability stack when deciding which options would be best for each organization. Determining the proper observability tools can be dependent on various factors like technology used and scope of issues, as well as practical matters such as budget and size. We believe this article then provides information to assess needs accurately and select suitable observability tools that could benefit any company.
