
AIOps Observability
& Automation Features
Topology-based observability and automation
Collection and aggregation
- Tests
- Changes
- Events
- Queries
- Logs
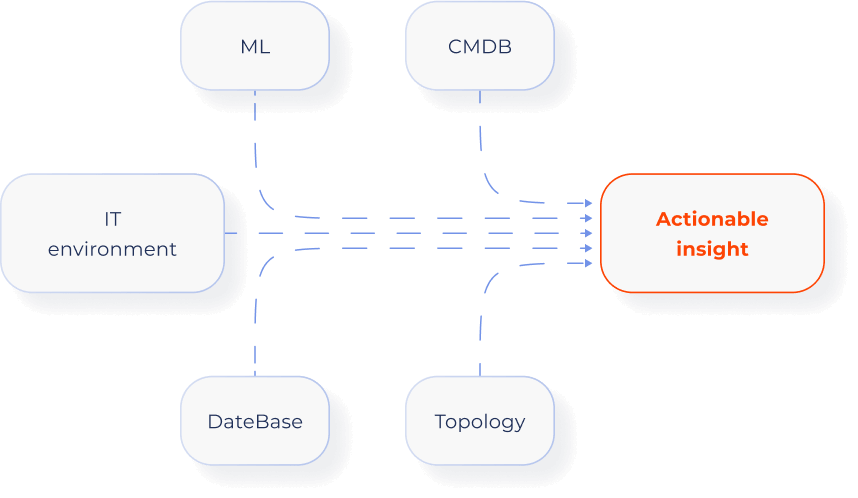
Enrichment and preprocessing
- ML
- Topology
- DataBase
- CMDB
Correlation
- Time
- Topology
- Context
- Low-code
Collaboration
- Cases
- Incidents
- Dashboards
- Reports
Automation
- Notifications
- Escalations
- Scenarios
- Scripts
Collection, transformation, and enrichment
Aggregate any data, from metrics to logs, into a single system to look for insights:
- Use Acure agents that are available for Linux and Windows
- Control agents via coordinators
- Collect non-agent data at an HTTP endpoint
- Customize connectors
Process data on the go:
- Parse and transform raw data and represent final data in a conventional form for further processing
- Configure event routing within the system
Identify the dependencies to detect and resolve incident faster
- Label with auto-clustering ML libraries
- Perform labeling based on own calculations and additional information
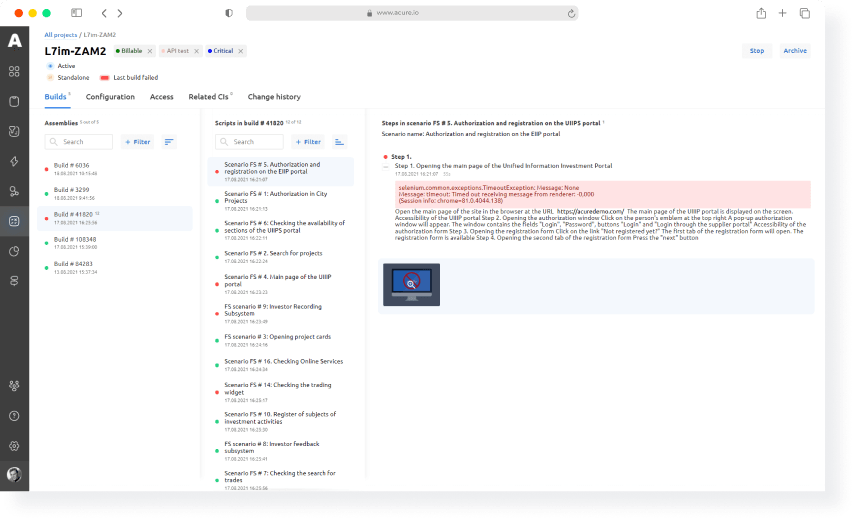
Continuous synthetic testing
Repair errors and failures before your clients notice them:
- Run your web interface, IVR, WebRTC, and equipment test scripts on Acure agents
- Flexibly manage test schedules
- Connect external test environments
- Check test result report and interpretation parser
- Use Jenkins and Gitlab CI integration templates
Analytics & ML
With Acure you can instantly progress giant volumes of data. We provide you with:
- Quick analytics of common failures that helps identify the root cause
- Real-time operation, instant trigger status reading, and bottleneck identification
You can also connect your ML models or use our standard models for deeper insights:
- Analyze and use ML in further calculations
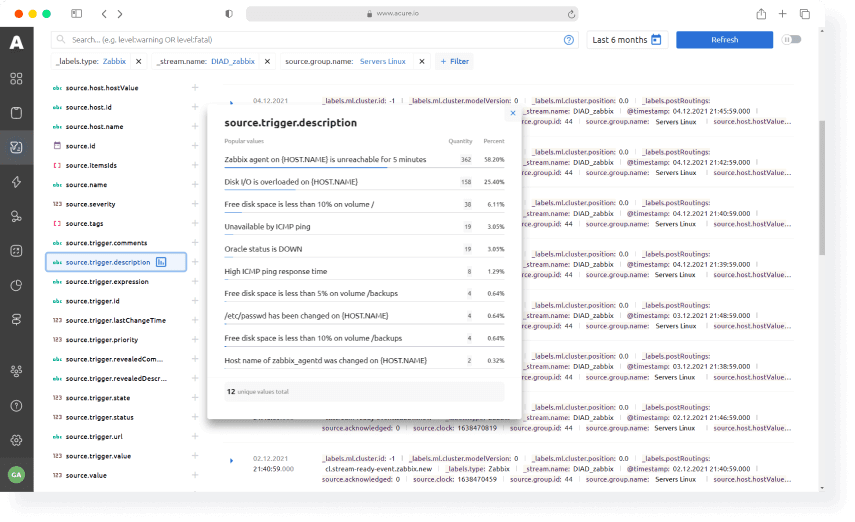
Correlation and deduplication rules
No need to aggregate duplicates and junk messages. Proper deduplication can reduce observability system noise by up to 90 percent:
- Filter messages in data streams handlers
- Aggregate data in a handler’s pre-filter
- Use standard data stream templates, such as Zabbix, Prometheus, etc., with built-in deduplication and correlation rules
Correlation helps identify dependencies between applications and systems constituting technology stacks.
Incident deduplication will allow you to sort out an incident storm — a situation when a monitoring system creates a multitude of similar incidents in case of mass incidents:
- Set up automatic signals - dynamic indicators of a change in the infrastructure that correlate and deduplicate incoming events
- Utilize correlation algorithms that take into account such parameters as text similarity, time, and topology
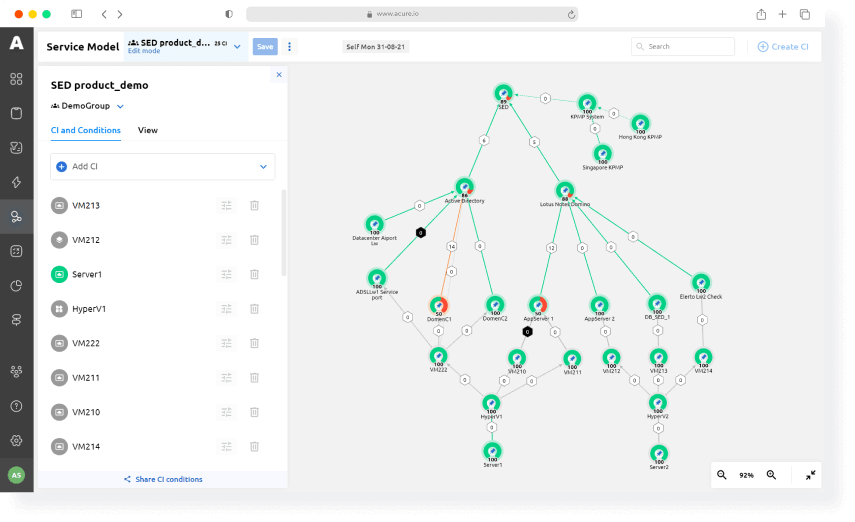
Configuration model and topology discovery
Supervise your entire technology stack on one configuration model map, represented as a state graph. Forget blind spots.
You need to always have up-to-date topology insights at hand to draw conclusions and run automatic commands.
In Acure, topology is updated automatically based on the data collected from various sources:
- Topology data from various virtualization and containerization platforms
- Discovery data
- Acure agents for identification
Each of the sources defines one or several areas of the configuration model. These areas are automatically fused together and correlated with the general configuration model by the automation scenarios.
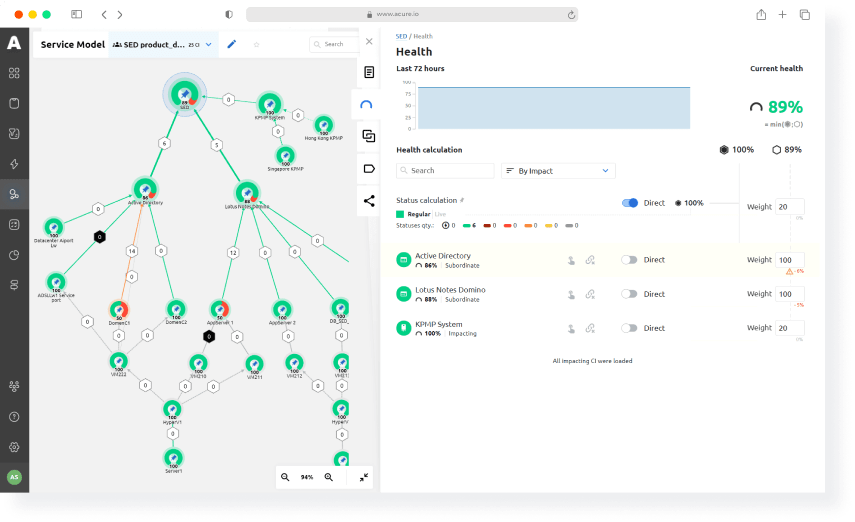
Root cause analysis and health metrics
Exclude work groups and situation centers to investigate incidents manually and boost your team’s performance:
- Perform dynamic correlation of siloed data for immediate root cause identification
- Easily check the topology's state and performance, anytime
- Configure impact weight for calculating health metrics
- Manage automatic incident routing to responsible persons
Team collaboration, cases, and incident management
Team collaboration is a beeline to resolving intricate multiservice incidents:
- Integrate customized plugins for DevOps and SRE collaboration
- Integrate popular instruments your teams are already using.
- Launch ChatOps principles with Acure
Work with a single incident management screen as an observability engineer’s primary tool:
- Automatically correlate and aggregate the alerts
- Track a failure’s impact on business-critical services
- Prioritize problems and setup lifecycle
- Adjust notification settings and automatic/manual running of auto-healing scripts
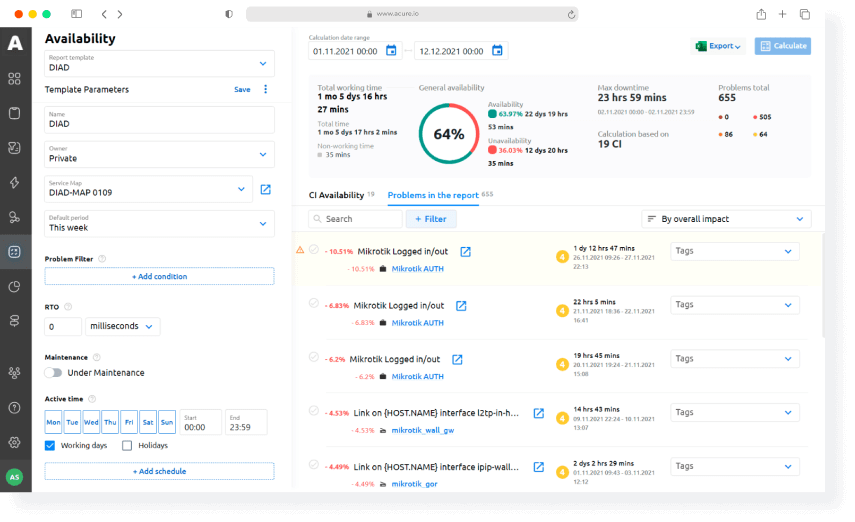
Availability reports and impact analysis
Get service availability reports and determine the SLA to track the performance of your employees and third-party teams:
- Calculate configuration item availability
- Calculate availability of data systems comprising various configuration items
- Calculate availability of complex data systems comprising various data systems
Employ impact and factor analysis to find bottlenecks:
- Manage configuration items’ maintenance window
- Manage system idle time (per work schedule)
- Manage RTO management
- Manage the impact of various components on the multiservice system