
Engineers spend hours trying to investigate why digital services are not working!
With Acure you will find the root cause in minutes!
🔎 This monitoring solution shouldn’t be free,
but it is!
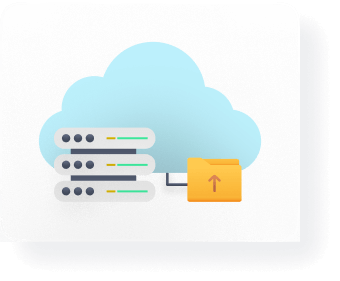
Collect data from:


and many other monitoring tools!


IT infrastructures now include 1000’s of dynamic components making them extremely difficult to analyze
Application and service performance monitoring can be an everyday struggle even for a highly skilled pro!


Common IT monitoring doesn’t give us a complete picture of all the data…
...сoming from dozens of sources! It means we can`t collect information useful for the best performance, and as a result, are unable to quickly resolve incidents!

We drown in alerts coming from different systems to several screens
Getting confused correlating the metrics of several charts and wasting valuable hours trying to find the reason of the problem!
Seems that familiar monitoring tools are no longer enough…
Todays engineers are using the log files and timeline dashboards that can signal a problem but are unable to:
- Present the IT infrastructure on a clear, transparent overview screen
- Show the relationships between the components of the IT complex
- Display the health of elements and their impact on the system
- Help find the root cause of the problem
That`s why we need a powerful platform for data correlation and end-to-end observability, showing all system components and connections from servers to services in one place.
A solution that will help us build dynamic maps of our data and update them in real-time with a minimum of manual labor.
And we made it!
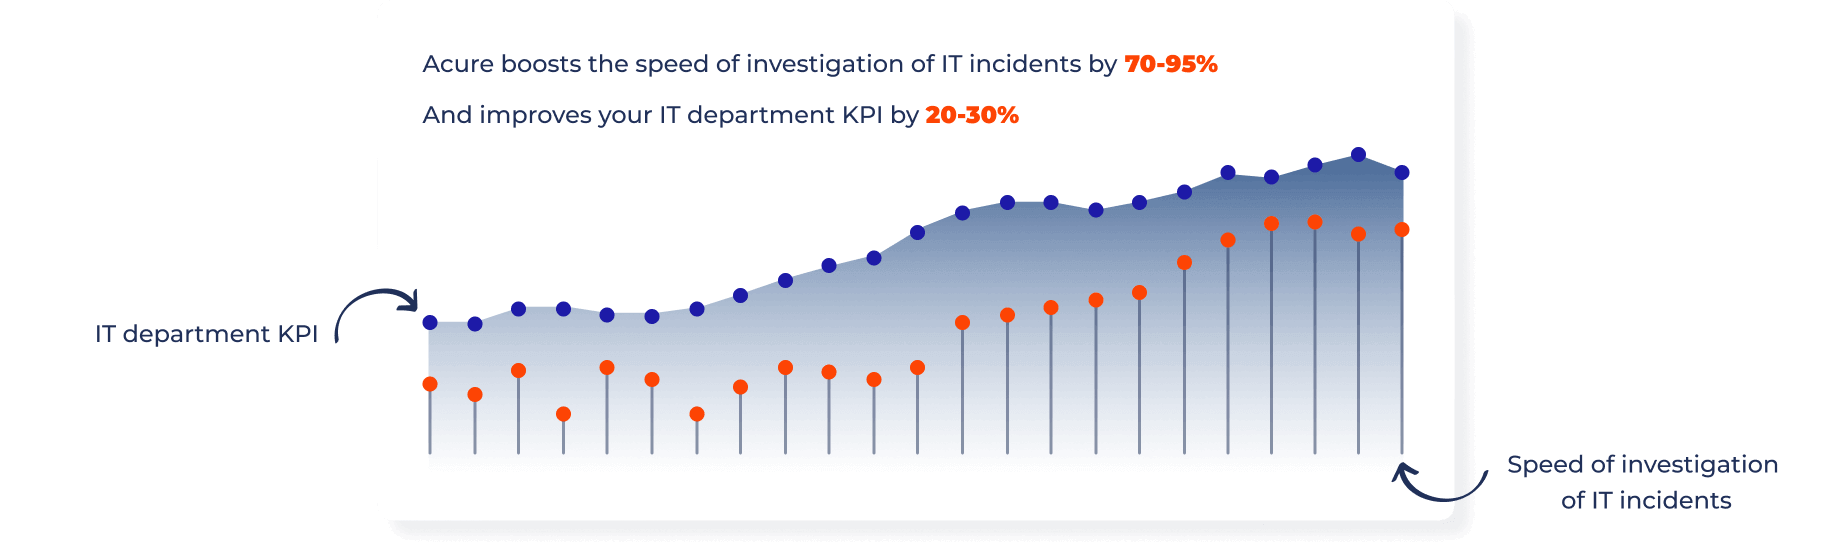
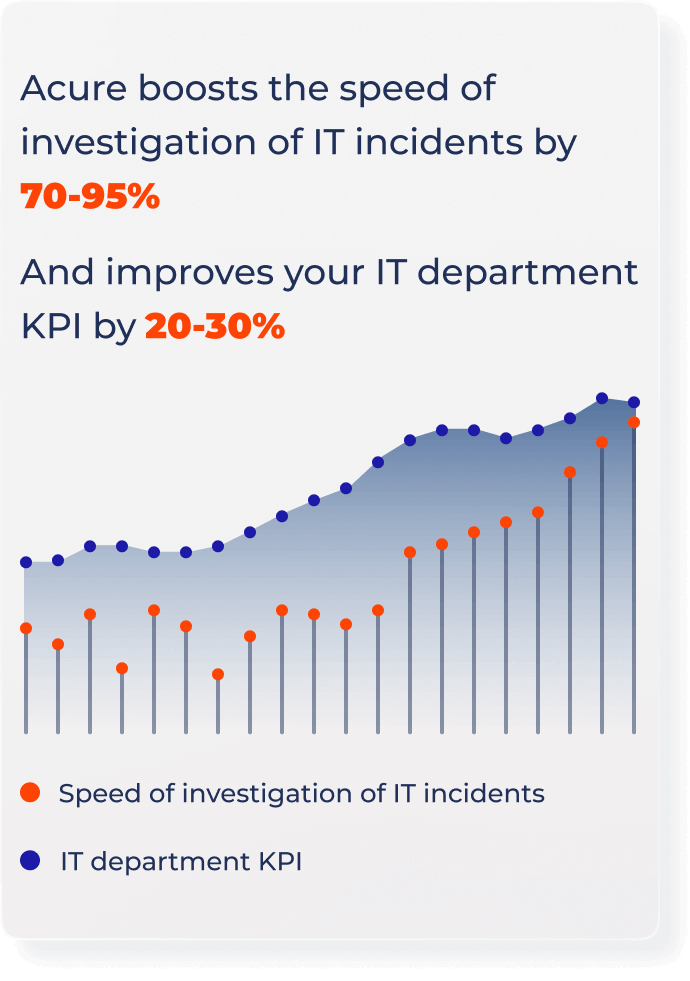
A tool that allows you to switch into Autonomous IT Ops, and boost all KPIs!
Why work harder when you can work smarter?
Meet Acure, a simple yet powerful AIOps monitoring platform that allows you to collect all your data on one screen and display the entire IT in a user-friendly dynamic topology graph.
Only in Acure AIOps Platform you can:

Collect disparate data from different sources in a single pane of glass. Including other popular monitoring systems like Zabbix, Prometheus, Splunk, and so on.

Automatically discover the dynamic dependencies of your services on one screen

Monitor the health of the system as a whole and each configuration item individually.

Localize incidents and perform root cause analysis to see the real cause of the problem.
Here is how Acure will help you to improve observability in 3 easy steps:
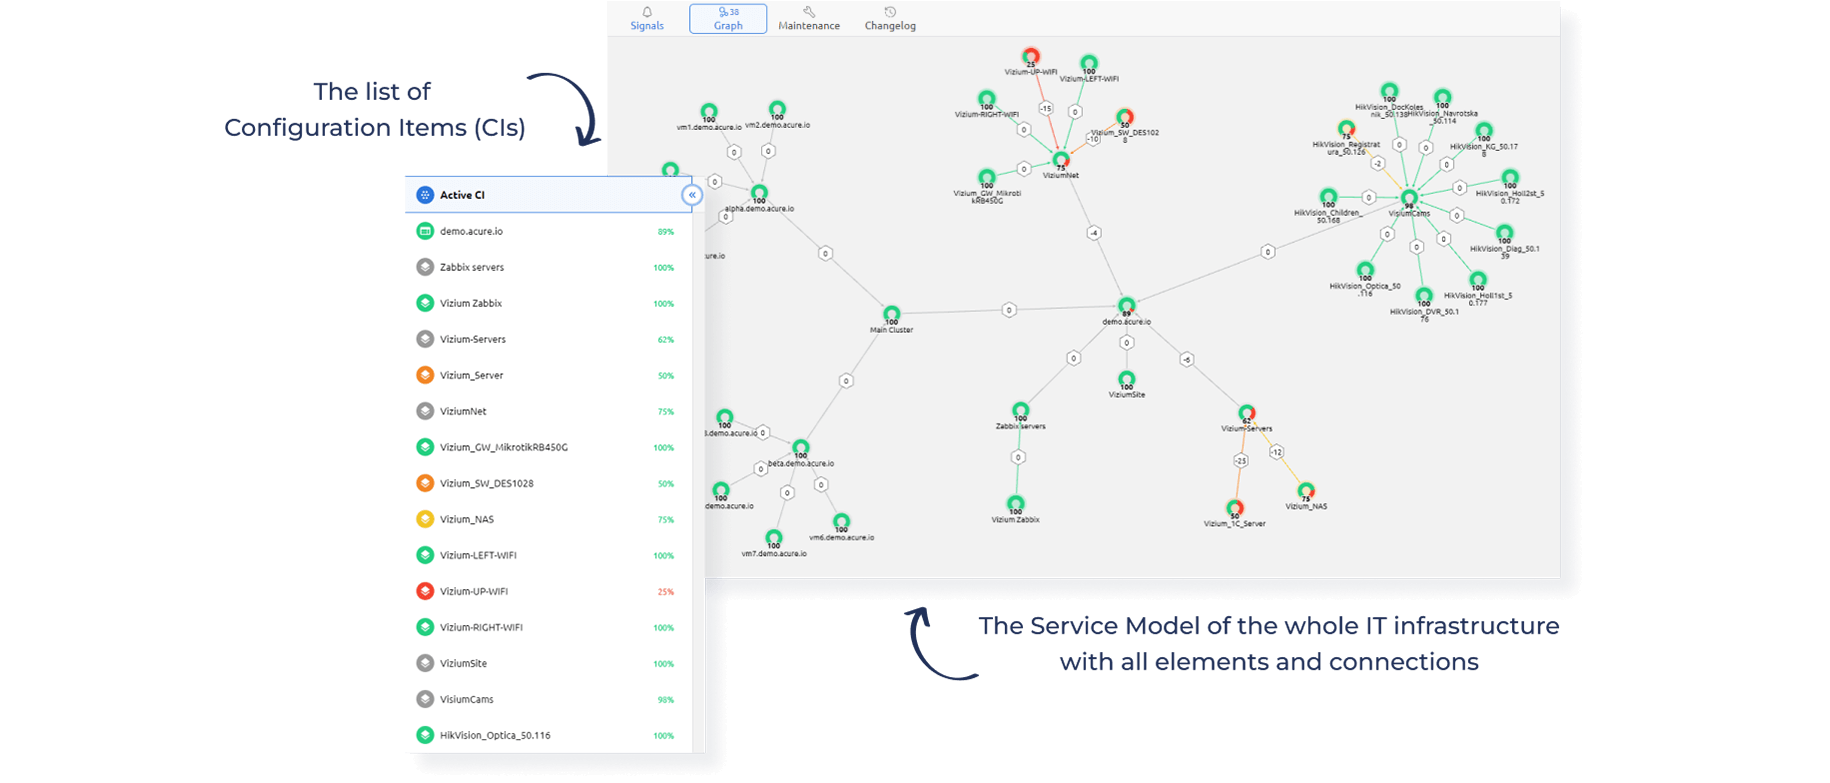
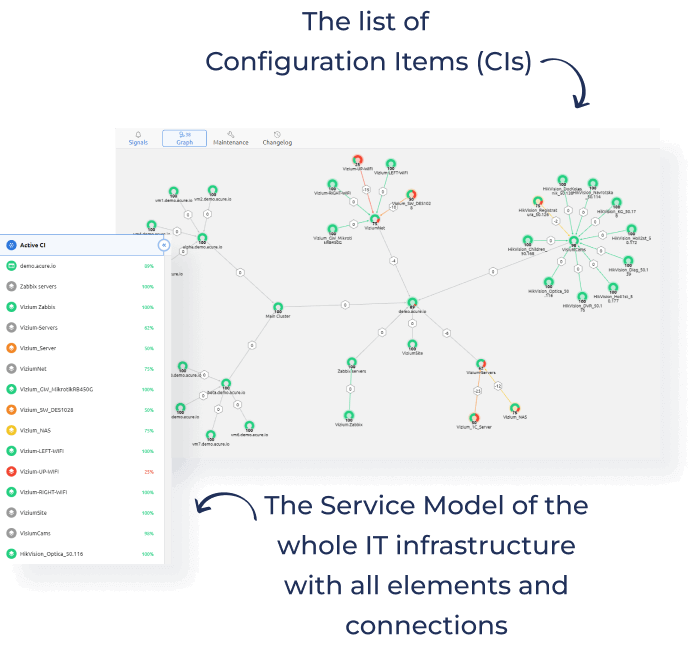
Step 1: Build the dependency map of IT infrastructure
Thanks to automation services Acure will map all your data and automatically update and build connections if new elements are added. All you have to do is watch the topology tree and let Acure alert you when the system needs some attention.
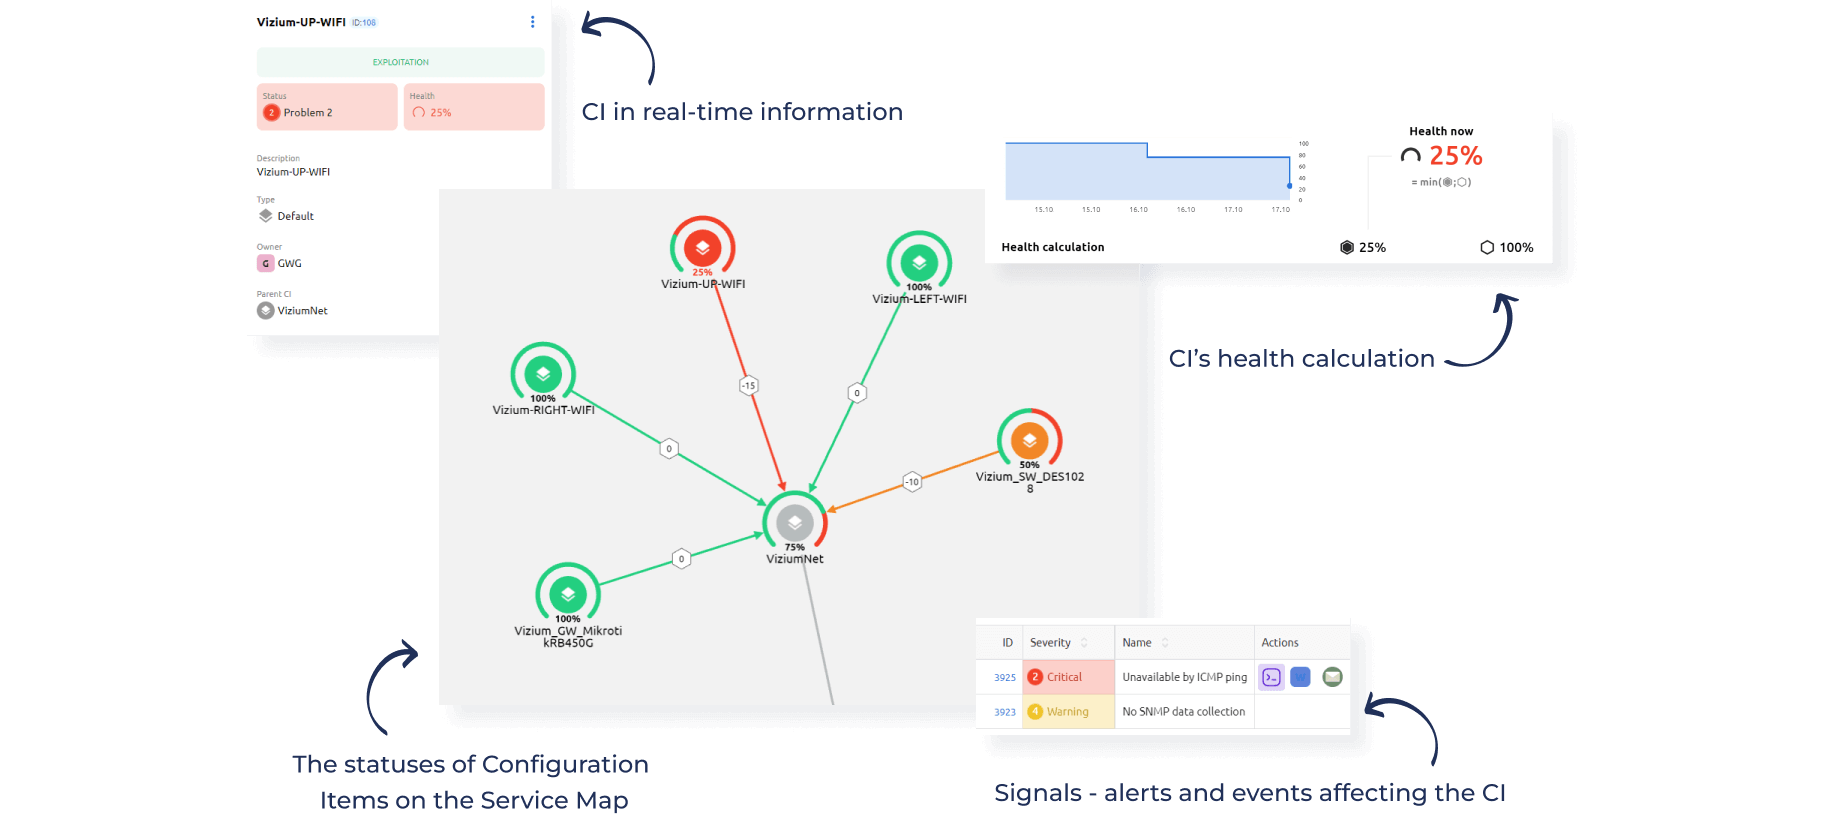
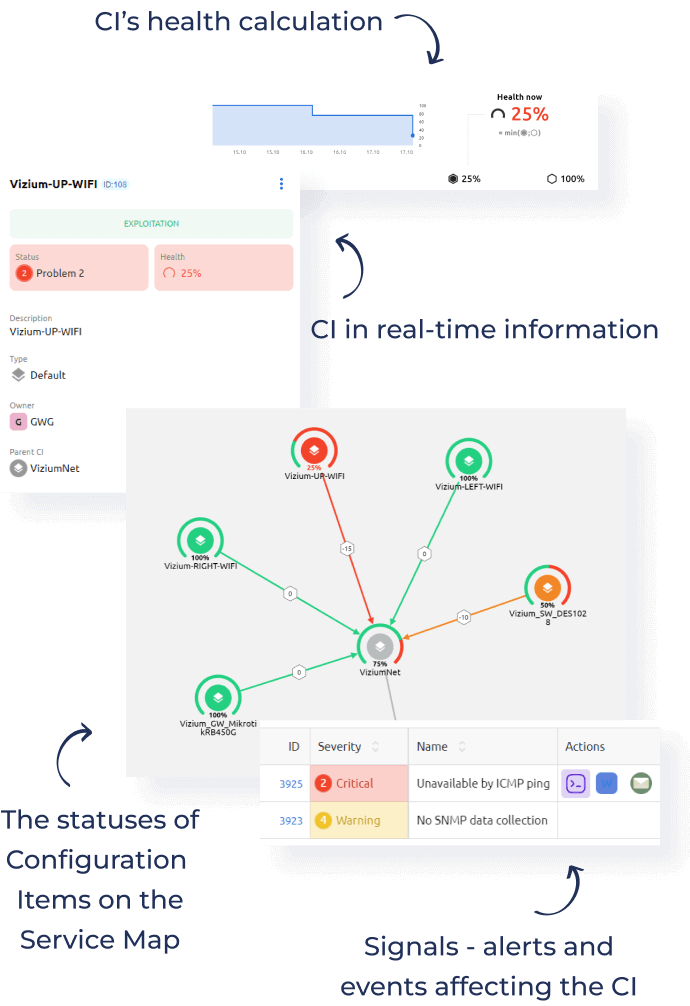
Step 2: Search for problematic CIs and find the root cause
After any changes in the topology, the health of the system is instantly recalculated, coloring the entire tree appropriately.
If the health of the root configuration item turns red, you will see in detail which factors most negatively affect the object and go through the branches to eventually come to the element that affected the health of the entire system.
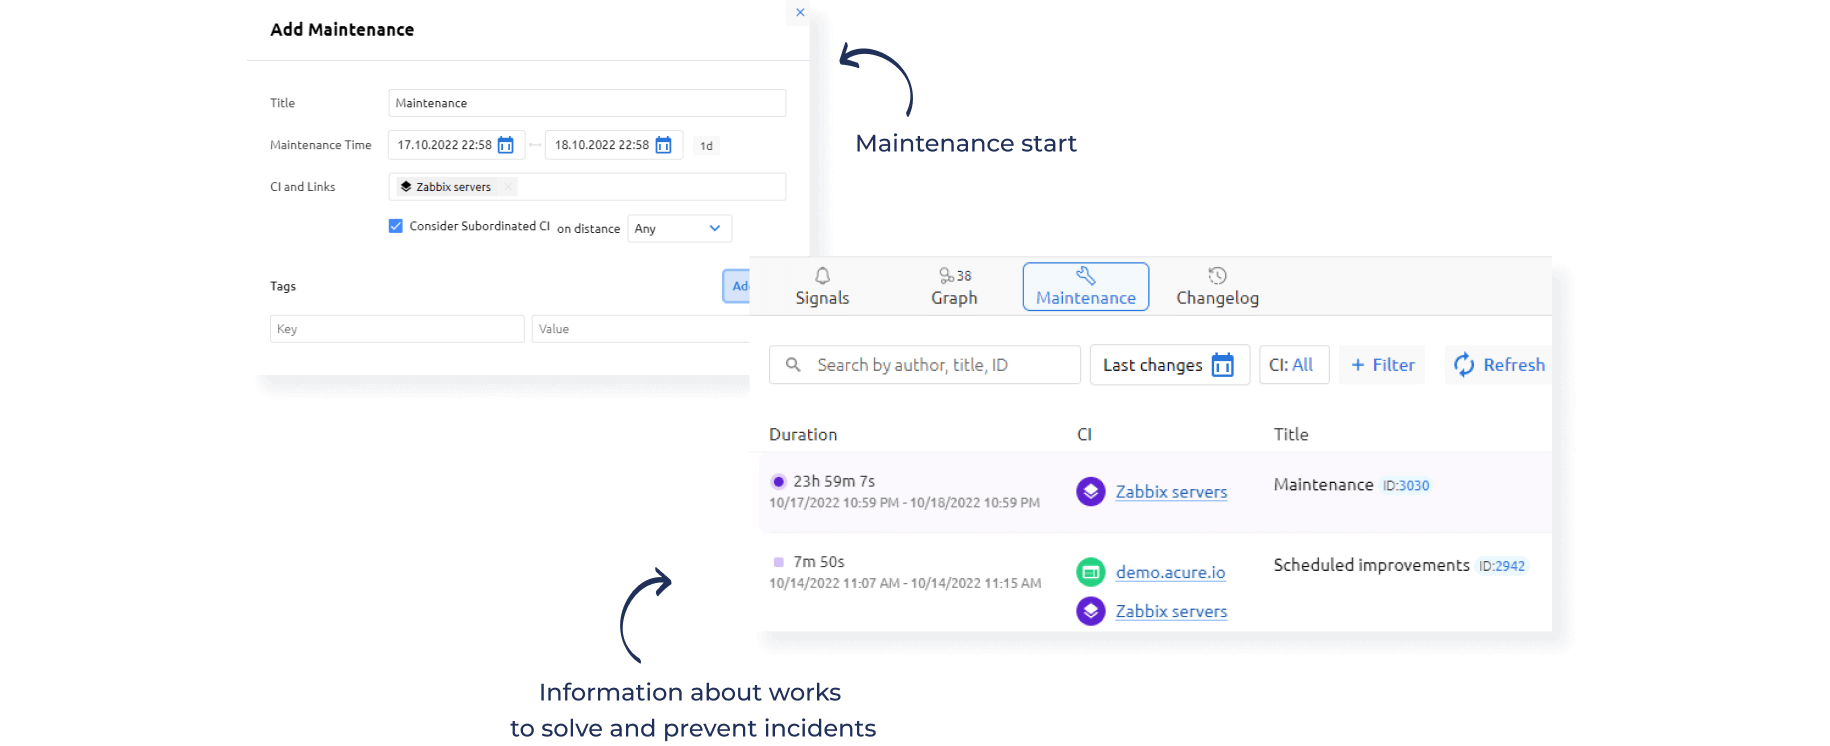
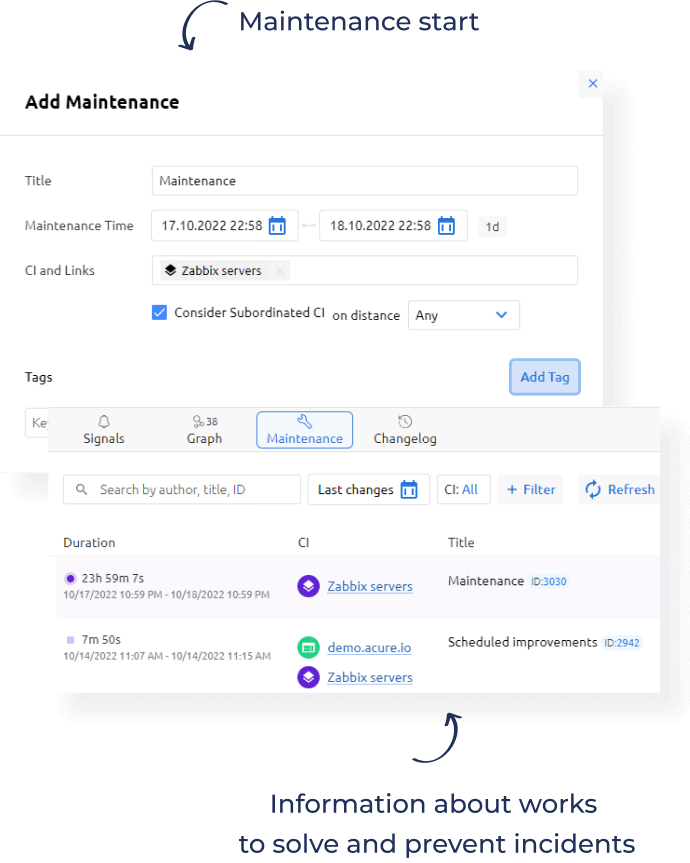
Step 3: Solve and prevent the problems
Put problematic configuration items into maintenance mode to avoid new alerts related to these CIs during the repair works.
Use maintenance history as a knowledge base to quickly resolve and prevent the similar incidents in the future.
Save your time, money and nerves
You will never again get lost between different screens, comparing thousands of events.
In Acure, one screen will contain all your data and conveniently show your IT with all connections and health metrics.
You will no longer waste hours investigating incidents. With our tool you will easily find the root cause of the problem and its impact in the topology graph.
Reviewed by the community — trusted by professionals


Forget about complicated monitoring! Turn your IT into a visible topology!


8 FAQs
Do I need a corporate email address to sign up?
No, you don’t need a corporate email address to sign up. You can sign up
with any of your email, or via Gmail and Facebook accounts.
Do I need a credit card to start using Acure?
No, you do not need a credit card. If you need to increase the amount of
data processed or tests conducted, then you can add your credit card and buy the necessary packages
or add-ons on our marketplace.
How many users can sign up from an organization?
Within one space you can connect anunlimited number of users.
Is the Acure Platform only for cloud users?
No, we are currently offering Free Acure Platform services for cloud
users, but we are always open to discussion with large enterprises to provide any custom solutions
for your business. Please, visit this page
to contact us.
Where can I learn more about Acure?
We try to support our users with up-to-date information through
communication channels such as weekly newsletters, blogs, and social media.
I have an idea how to make Acure better, how can we collaborate?
We are actively growing our community and ready to offer excellent
partnership services. Please, contact our community manager via marketing@acure.io
Why is Acure free?
Our platform is free for IT professionals, but if you need more data
gathering and managing big IT infrastructure it will not be free. You can choose right plan on this page.