Manual Creation of Signals 👨💻
In the last update, we released a new dynamic feature instead of static triggers – signals – that report the changes of any parameter from the regular state and are mainly intended for deduplication and correlation of primary events. The management of signals in Aсure 2.0 was entirely handled by automation scenarios: you’re writing several scripts on a low-code engine – and the platform itself opens a signal in case of changes in the system, sorts incoming events and assigns them the appropriate status. When you are just waiting for a line with the “Fatal” severity not to appear in the table.
But what if you found a problem, but the system did not notify you? What if you were informed about the unavailability of a service, while you were glad that there were no alerts? At the same time, the script was successfully compiled, and no code errors were issued, but the signal did not open. Of course, in this case, you need to check the script, look for the reasons why it did not work out and debug it, which can take time. But what to do with the incident at this moment and how to add its system so as not to lose information about it? Acure 2.1 provides the answer.
In the new version of Acure, in addition to the standard scenario management, signals can be added manually.
To create a Signal manually, go to the Signals management screen and click the Сreate – Signal button in the upper right corner.
Fill in the creation form values and press the “Create Signal” button.
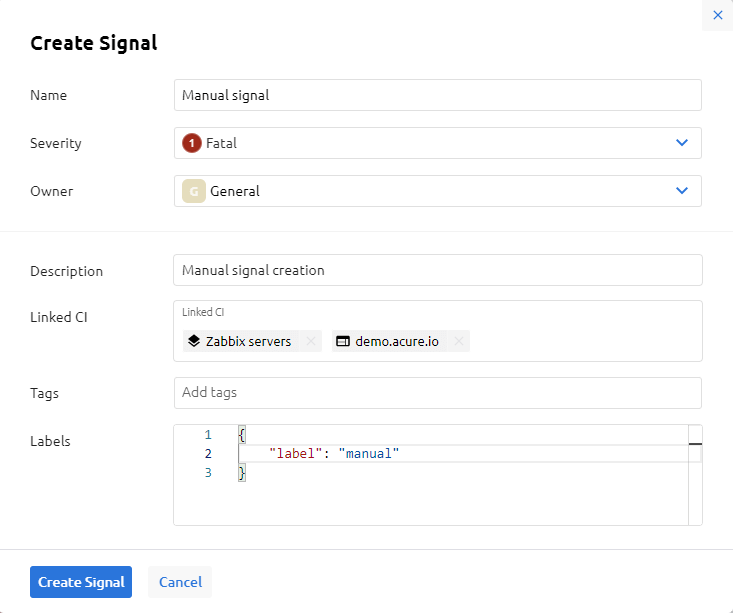
After creating the Signal, select the required configuration item in the CI list. If the Signal was created without reference to the CI, set up the filter for displaying Signals without CI accordingly.
To view detailed information about a Signal, go to the Signal card by double-clicking on the corresponding signal in the table.

Availability reports will also take this signal and add it to the statistics. Don’t forget to go back to the script and check why the automation didn’t work 😉
📖 Read more about signals in our documentation.
CMDB Table View 📋
Another hallmark of Acure is the auto-building of CMDB and the presentation of the entire IT infrastructure in the form of a single graph on one screen, which is very convenient, including for root cause analysis, when you can identify a problematic element by the links between configuration items.
However, this functionality was not enough for finding bottlenecks, analytics and reports. This is why Acure 2.1 introduces the CMDB table view.
Switching between SM views (split and table) is very simple and available using the corresponding buttons in the upper right corner of the SM Maps section. The table view displays CIs corresponding to the current CMDB filter or SM Map.
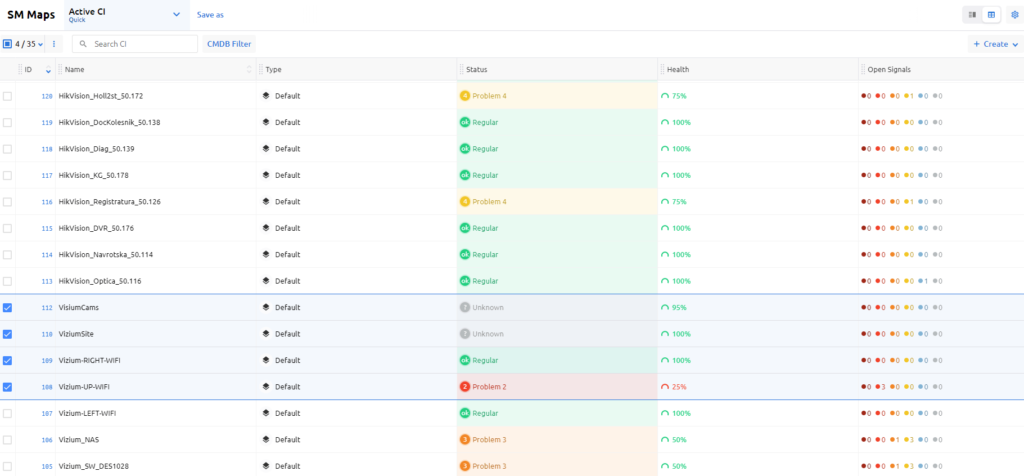
This is a database of all your CIs with the corresponding parameters. Basic information about CI contains: CI ID, CI name, CI type (name and icon), CI Status (name and color), CI Health (percentage and color), Open signals for CI, CI Owner.
You can also customize the composition of the table according to your needs and requirements. Just click on the “gear” icon in the upper right corner of the “SM Maps” screen.
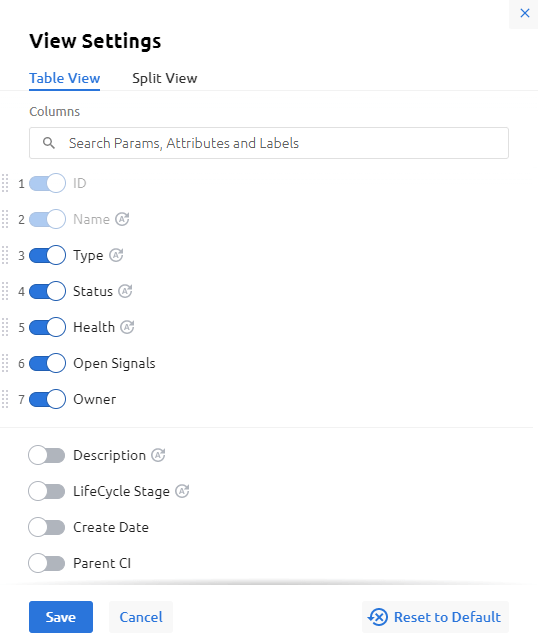
In addition to the basic information, you can add other information related to the CI in the table view.
Interface Improvements and Other Features
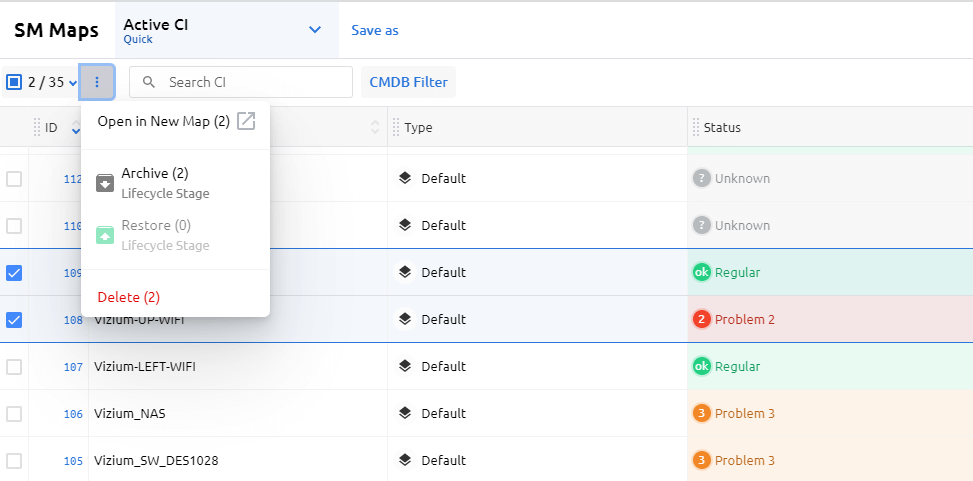
In addition to the table CMDB, the new release of Acure also includes interface improvements to optimize work with several hundreds of thousands of CIs. Bulk operations are now available when working with CI: after multiple choices of CIs you can archive, unzip selected CIs or delete selected CIs.
The automation engine has also been updated with new functions, allowing you to use new features of the SM API in automation scenarios. For example, there is a new function FilterConfigItemsExtended for high-performance scenarios.
