Big Data
Big data refers to the enormous, complicated volumes of data that might be either structured or unstructured. However, what organizations do with the data impacts more than just the nature or volume of data.
Big data, notably from new data sources, is simply a term for bigger, more intricate data collections. These data compilations are so large that already existing data processing software face difficulties handling it. However, these great data compilations can be taken advantage of to solve issues that were nearly impossible to solve earlier.
Big data analysis will help generate information that will eventually help with the decision-making stages and provide support while making critical business implementations.
The emergence of big data depended on the creation of open-source frameworks, making massive data more manageable and less expensive to keep.
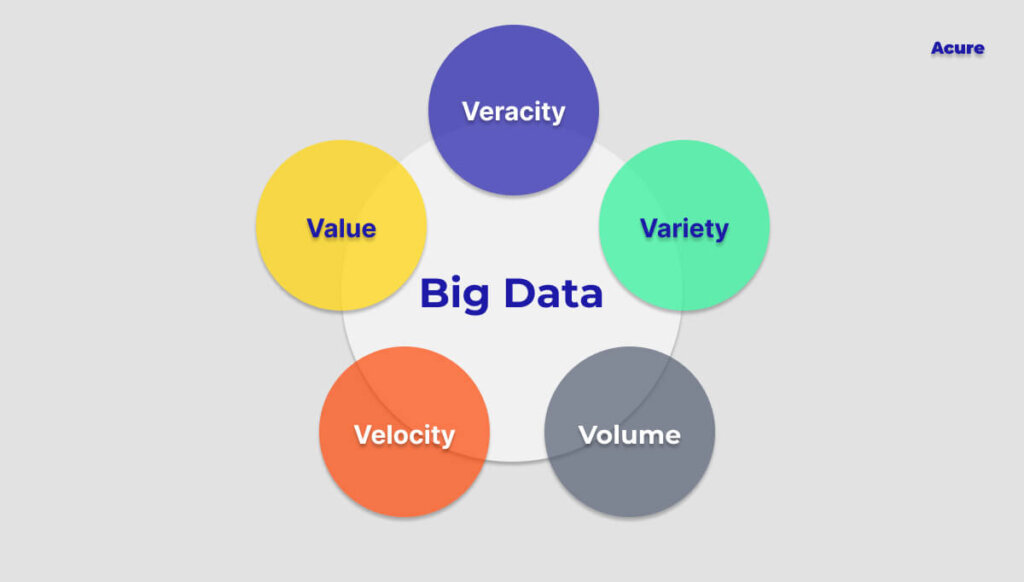
The Popular V’s of Big Data ✌️
Industry analyst Doug Laney introduced the three V’s in the early 2000s that defined big data in easy-to-understand statements. Let’s look at the V’s that together give meaning to big data.
Initially, only volume, velocity, and variety were the V’s that were introduced but later on, veracity and value were also included in the list.
1. Volume
The initial of the important V’s of big data, volume, refers to the quantity of data that is available to us. Volume, or the original size and quantity of information obtained, can be thought of as creating and giving basis to the foundation of big data. Big data can be used to describe a sufficiently massive set of data.
2. Velocity
Velocity refers to the high speed at which big data is accumulated. The speed at which data is created and managed to satisfy demands influences the data’s potential where a significant and constant flow of data is present.
Data comes from various sources, including social media platforms, databases, computers, smartphones, etc. Dealing with problems like “velocity” might be easier compared to other difficult sampling problems.
3. Variety
The range and diversity of data kinds are referred to as variety. An organization may collect data from various sources, the value of which may differ. Data might originate both inside and outside of an organization. Unstructured, semi-structured, or structured data can be collected. The standardization and dissemination of all the data being gathered pose a problem in terms of variety.
4. Veracity
Veracity relates to sampling errors and uncertainty that is, readily available data can occasionally become disorganized, and both quality and precision are challenging to manage.
The gathered information can be incomplete, erroneous, or unable to offer any useful, insightful information. Veracity, in general, refers to the degree of confidence in the data that has been gathered. Because there are so many different data dimensions arising from several dissimilar data types and sources, big data is also unpredictable.
5. Value
This is a reference to the benefits using big data can offer, and it has a direct bearing on what businesses can do with the information they gather. Data by itself is useless and unimportant; information must be extracted from it by transforming it into something worthwhile. Therefore, value can be identified as the most significant of the five virtues.
It is necessary to be able to extract value from big data because the importance of big data greatly depends on the conclusions that can be obtained from them.
Interesting Trends Emerging in the Big Data Industry
Data Quality Testing
Data quality checking protects your company from inaccurate data. It’s time to think about a remedy if the quality of the company’s information assets is affecting sales.

For businesses across all industries, accurate data is crucial for statistics and data-driven solutions. Without this information, businesses struggle to remain effective, profitable, and competitive in their market.
Preserving data quality is essential to creating a successful company, especially given how many aspects of daily operations it now supports. Better company decisions are made as a result of high-quality data, which also benefits customers.
Writing test strategies for certain products and initiatives that concentrate on the project’s objectives will be necessary. Before creating and running tests, data sources need to be reviewed after such criteria have been determined.
To provide IT and data owners with an audit record of all access instances, live monitoring, mapping, and alerting of exactly who is receiving and accessing which type of data when and from where helps keep them aware as to how sensitive data is being utilized. The procedure guards against data breaches and misuse.
Anomaly Detection
Data mining’s anomaly detection process, also known as outlier analysis, seeks out data points, occasions, and/or observations that differ from a dataset’s typical pattern of activity.
Unusual data can point to serious occurrences, like a technological malfunction, or promising opportunities, like a shift in consumer behavior. Automated anomaly detection is increasingly being done using machine learning.
You may use your resources more wisely because monitoring systems will keep hold of your infrastructure, including many other things. You will become more productive as a result, which is undoubtedly essential in your decision to utilize a monitoring system.
With the knowledge that you will be notified as soon as an issue occurs, your employees will have more time to focus on other activities.
However, with data monitoring, the data is automatically verified to make sure it is accurate at every stage. If a discrepancy is discovered, the data is flagged so that it may be reviewed and any necessary modifications can be made. Your analytics and reporting become more reliable as a result.
The analytics reports may become biased if any data is altered. These reports are designed to assess the company’s performance and identify areas for improvement. But you can’t choose the best course of action for your company and customers if you don’t have the appropriate information.
Shift from Data Monitoring to Data Observability
Teams from DevOps and ITOps must advance from monitoring to observability. Software and systems that can be seen and used to provide answers to inquiries about their behavior are said to be observable.

By releasing data from compartmentalized log analytics programs, observable systems encourage research as opposed to monitoring, which depends on fixed views of static resources.
You can engage with customers better the more precise the data is. Monitoring data along with observability enhances connections in a variety of ways. Furthermore, accurate information reveals any potential areas for improvement. You can concentrate on customer retention rather than gaining new customers if your analytics suggest that you frequently acquire new customers but rarely see those same customers return.
Correct data monitoring and observability reveals the demographics of your clients. This data can be utilized to target your consumer base more accurately, saving you money on marketing to uninterested parties.
📝 You can read more about the differences between Data Monitoring and Data Observability in our blog.
Low-Code and No-Code
More and more companies have recently been trying to make their solutions more flexible, allowing data engineers to independently adjust systems for themselves and customize functionality without having deep knowledge in programming. Low-code and no-code come to the rescue in this case, when you can create entire scripts without writing long lines of code.
📝 We talked about this approach in more detail in the article.
This is a very promising direction in light of the data decentralization trends and skill shortage.
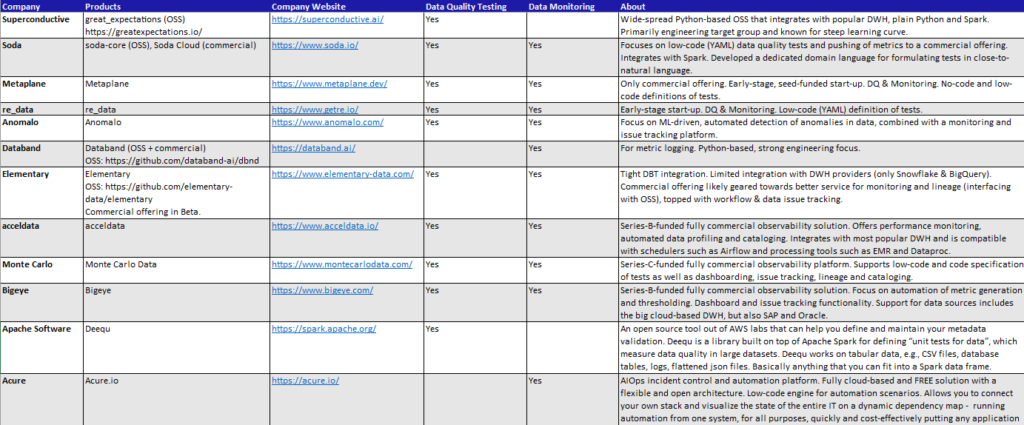
New Trends – New Stars ⭐
Obviously, new trends also impact big data solutions and bring new players to the market that match these trends. In the following research, new “stars” are collected, which currently show promising growth in data monitoring, data observability and data quality testing
Download research on new data observability and monitoring solutions:
A Cure for Big Data
Acure.io is one of the fresh and promising solutions for working with big data. It is not just another monitoring system, it is an AIOps platform that integrates all other log and alert monitoring systems, takes data from there, puts it on a single dynamic link map, and automates the processes of monitoring it.
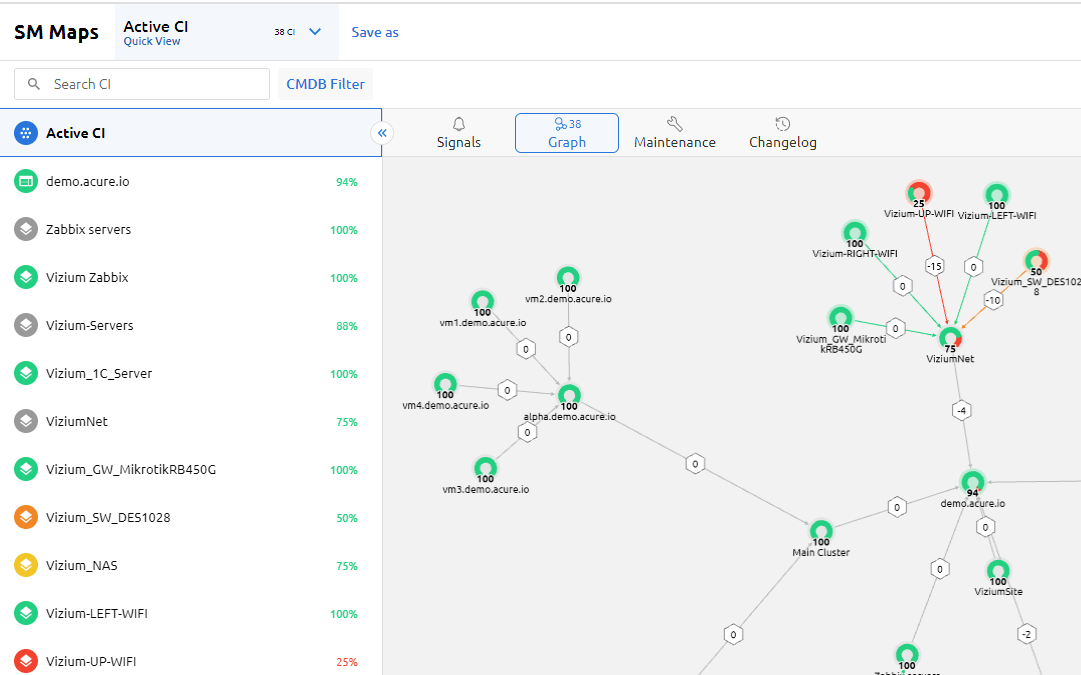
The dependency map is built automatically based on data from existing monitoring systems and other tools. This is vital for dynamic environments, such as modern cloud ecosystems and microservices on Kubernetes. It not only improves data observability but also provides rapid identification of the root cause of an incident and the impact of various technical resources on business services.
In order to avoid information noise, a solution called Signals is used. It aggregates, normalizes and enriches events collected from various monitoring tools and automatically correlates alerts into actionable insights.
As for automation, here Acure also follows trends and uses a Low-code scripting engine (including auto-building and auto-correlation). Running built-in scripted automation tools with low-code and external runbooks allows workflows to be automated for faster incident response.
👉 Can’t wait to try all these features in action? Create Userspace in Acure.io!
Wrapping Up
The final analysis and the implemented choices can only be foolproof if the data has been handled well and can be trusted. Being dynamic has several advantages. Organizations that are data-driven perform better, have more predictable operations and are significantly profitable.
Businesses must fully take advantage of the benefits provided by big data to remain at the top of the pop league. They must also go for a more data-driven path so that they can base their choices more on the facts provided by big data rather than just relying on intuition.
Businesses use big data analytics to reap benefits and understanding from large quantities of data. Big data is being used to fuel modern advanced analytics projects like AI and machine learning.