
Acure's Kubernetes Observability Solution: Gain Control, Insight, and Efficiency
When Kubernetes becomes part of your technology stack, you might feel overwhelmed with the need for specialized skills and the various challenges they present.
From configuring multiple separate monitoring tools, such as apps for collecting metrics and logs, storing and rotating collected data, visualization, alerting, and providing access to each tool for team members can be tedious and time-consuming.
...To constantly fixing annoying problems, such as running out of disk space on a volume or an expired SSL-certificate, that can go unnoticed if not caught in time.
Since you need to cover all the levels involved in the operation of end applications, do you embark on a steep learning curve, or onboard costly DevOps experts to manage the complexity?
There's no need for a difficult decision! Simply test our Acure Kubernetes Observability Pack which significantly simplifies managing K8s and provides enhanced visual clarity!
Why Acure is Your Best Choice? All-in-1 Monitoring & Observability Multi-Tool Pack
Acure makes it simple and efficient to monitor your Kubernetes environment, providing you with expert-level insights. With Acure's Kubernetes Pack, you can:

Get value immediately:
Easily deploy, set up, and troubleshoot using our pre-configured monitoring tool with just a few CLI commands or by launching our Helm chart.

Gain comprehensive insights:
Understand microservice dependencies, application performance, platform health, and Kubernetes resource consumption across your environment.

Proactively identify issues:
Automatically receive notifications when health and performance metrics cross defined thresholds, enabling developers and SREs to effectively address performance and reliability concerns.

Integrate your favorite tools:
Effortlessly monitor Kubernetes components' health and performance with integrated observability tools for metrics, log queries, collection, alerting, and notifications, eliminating data storage and dashboard configuration concerns.
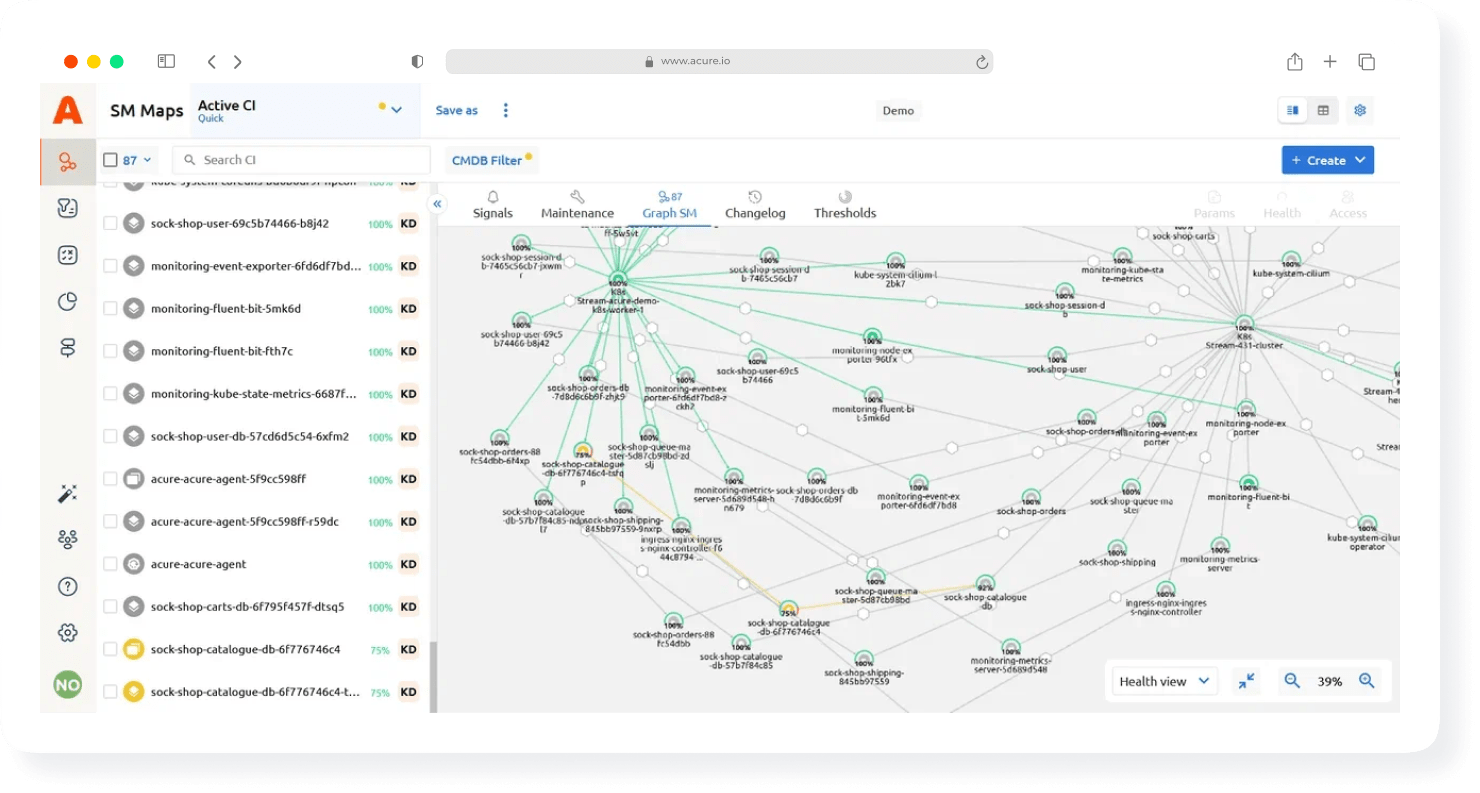
Real-time Observability for Kubernetes Infrastructure
Automatically discover and monitor workload objects, ensuring full coverage of your cloud infrastructure
Visualize critical information across your entire Kubernetes cluster, regardless of its size.
Track availability, health, and resource utilization:
- pod and workload overviews to quickly identify unexpected differences in app and microservice instances;
- native Kubernetes events to diagnose common platform problems: crash loops, failed image pulls, and OOM containers.
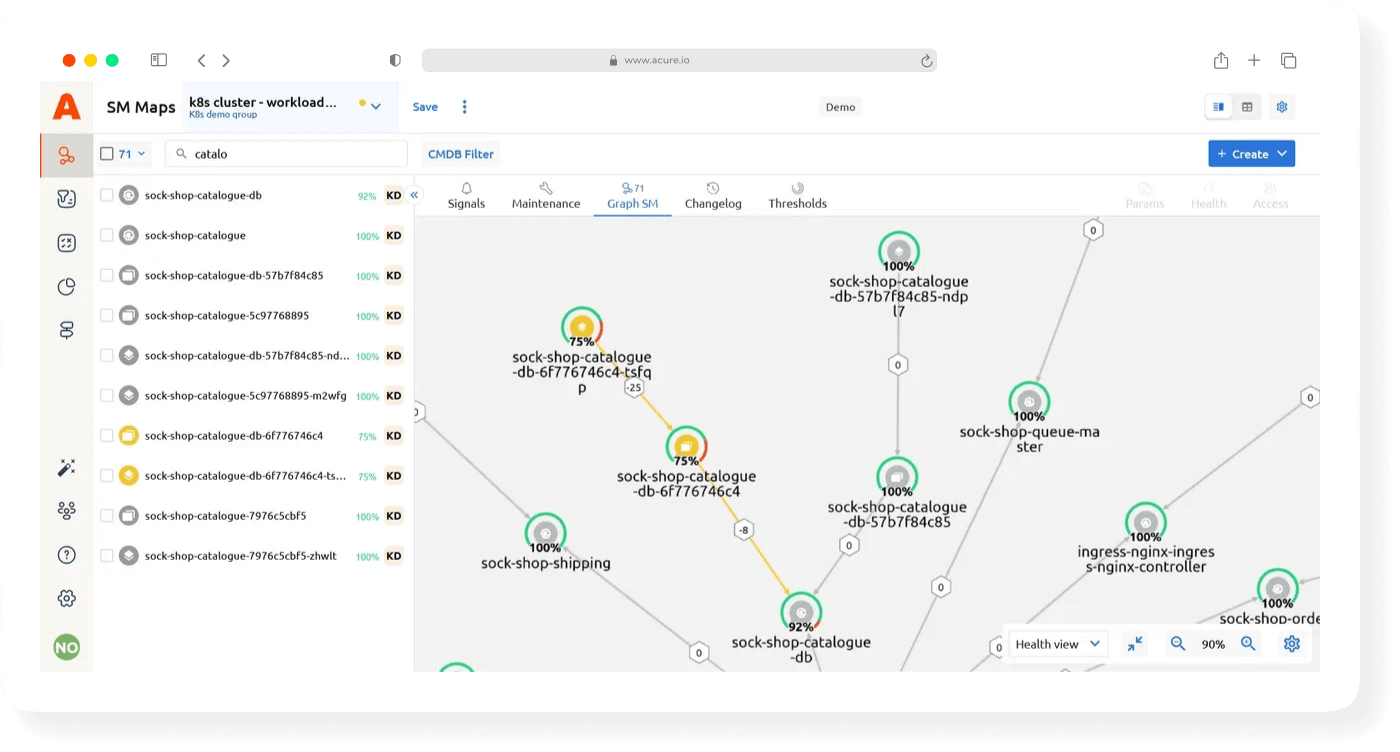
Accelerate Troubleshooting
Identify and resolve issues faster with high-level monitoring, color-coded health visuals, and comprehensive observability data, all in one place:
- color-coded health visuals and icons to faster issue identification and resolution;
- workload filtering by namespace and workload type to effortlessly detect pending and failed pods;
- rapid navigation within Kubernetes namespaces to locate pending or failed pods;
- performance analysis to identify and diagnose CPU-throttled workloads.
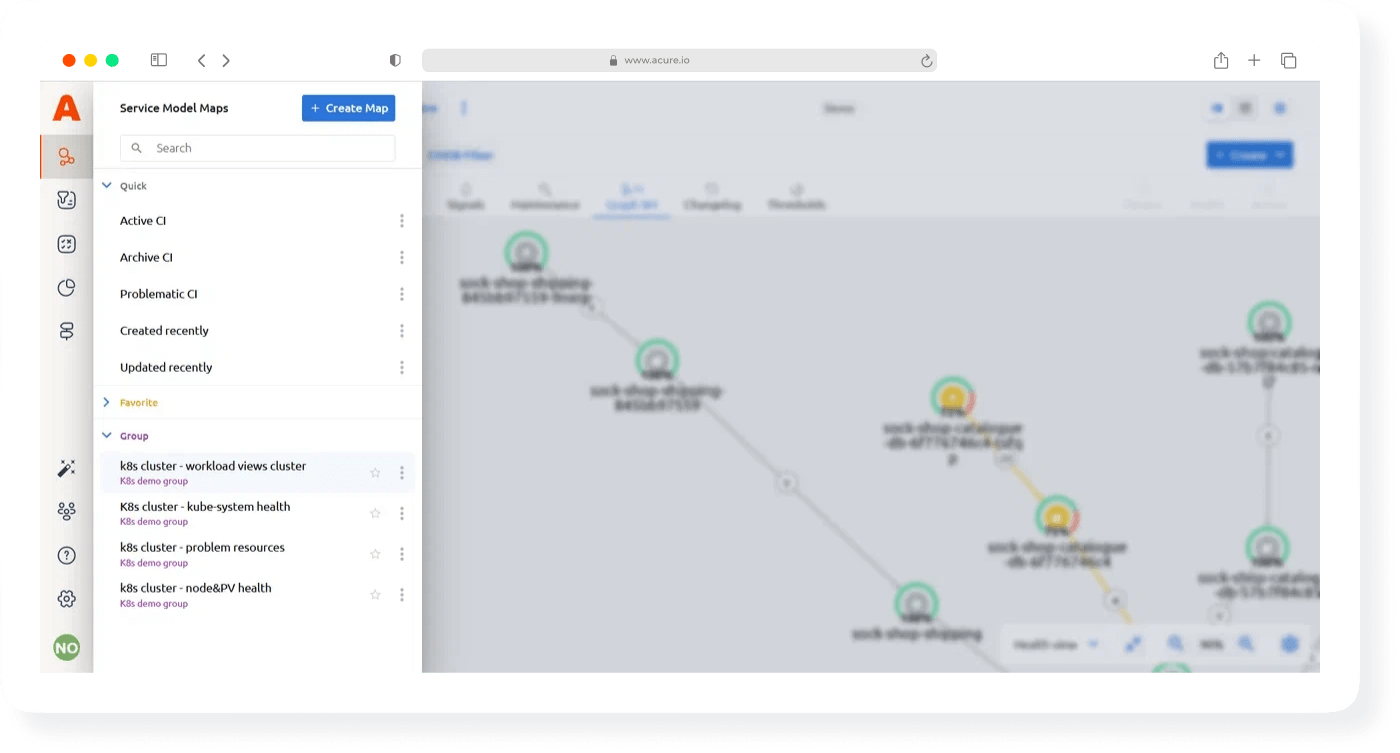
All-in-One Observability Solution for Infrastructure and Application Teams
Use Acure platform to:
- collect, correlate, and display crucial metrics, logs, and events in context;
- set customizable views to tailor individual views for different teams, ensuring each team can focus on their specific tasks.
- configure an optimal depth and granularity of objects: for a high-level overview of cluster health or performance investigation of a specific group of services;
- analyze and understand the business impact of issues in your cluster with Service Maps that reveal affected components and services.
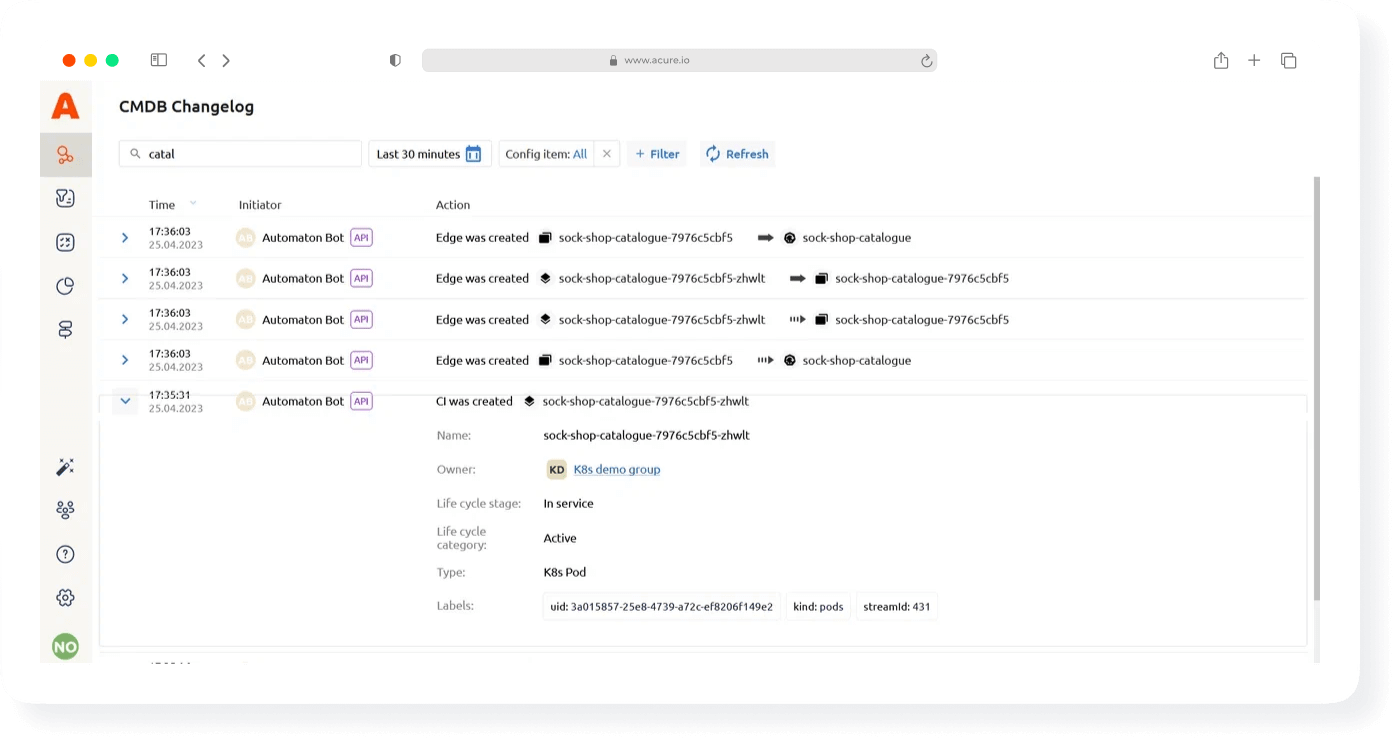
Change Analysis
All of the data in Acure is stored and available for retrospective analysis.
Track changes in your environment and analyze their impact on your services. Access historical data for Kubernetes resources, logs, events, incidents, and alerts, even after their life cycles have ended.
Platform Flexibility
Customize metrics, rules, alerts, and intervals, or connect custom metrics from your applications or self-written exporters.
Acure supports multiple log collection platforms (such as Elasticsearch and Fluentd) and best troubleshooting practices with smart problem clustering and hints for quick resolution.
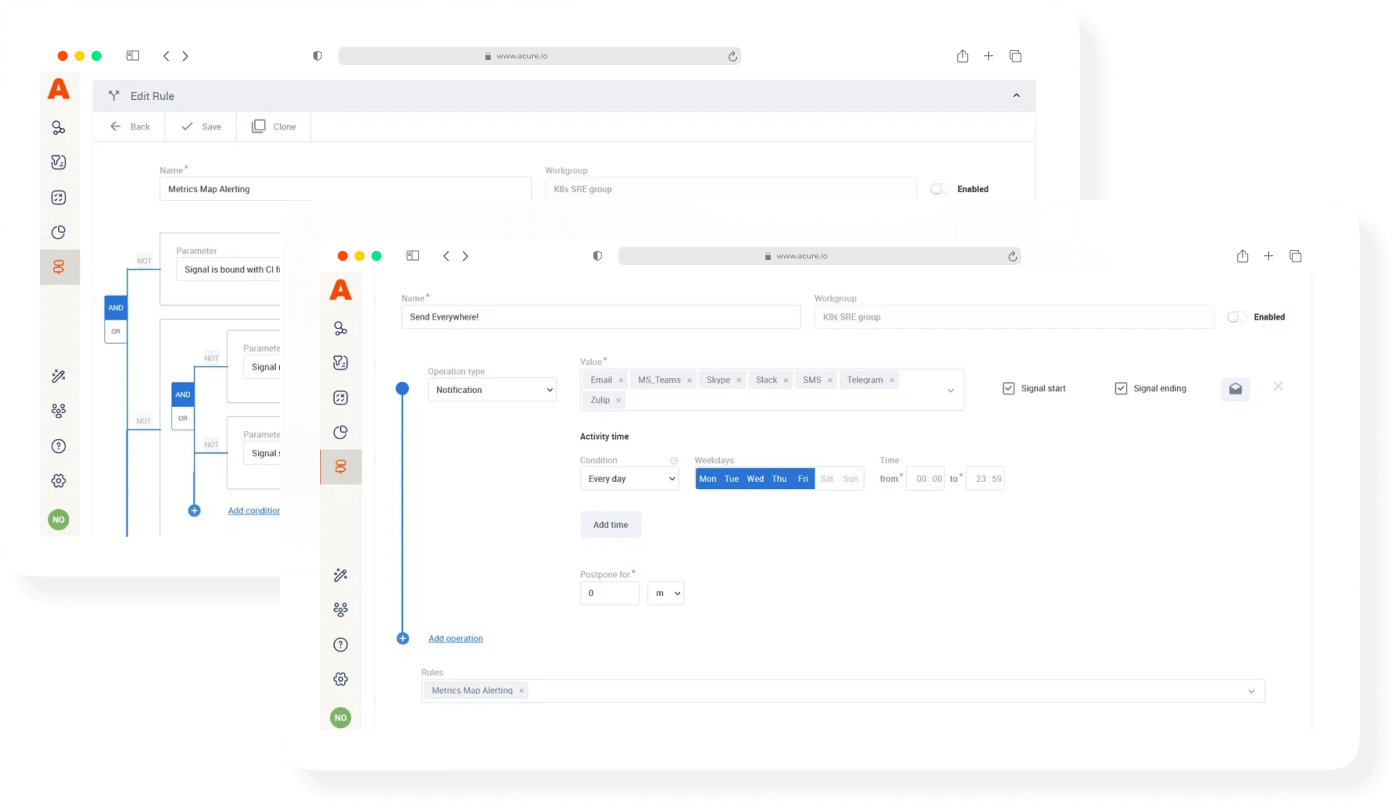
Unified Notification Service
Don't bother the development teams with minor problems!
Configure intelligent alerts, eliminate false positives, and reduce alert noise for a more streamlined notification experience.
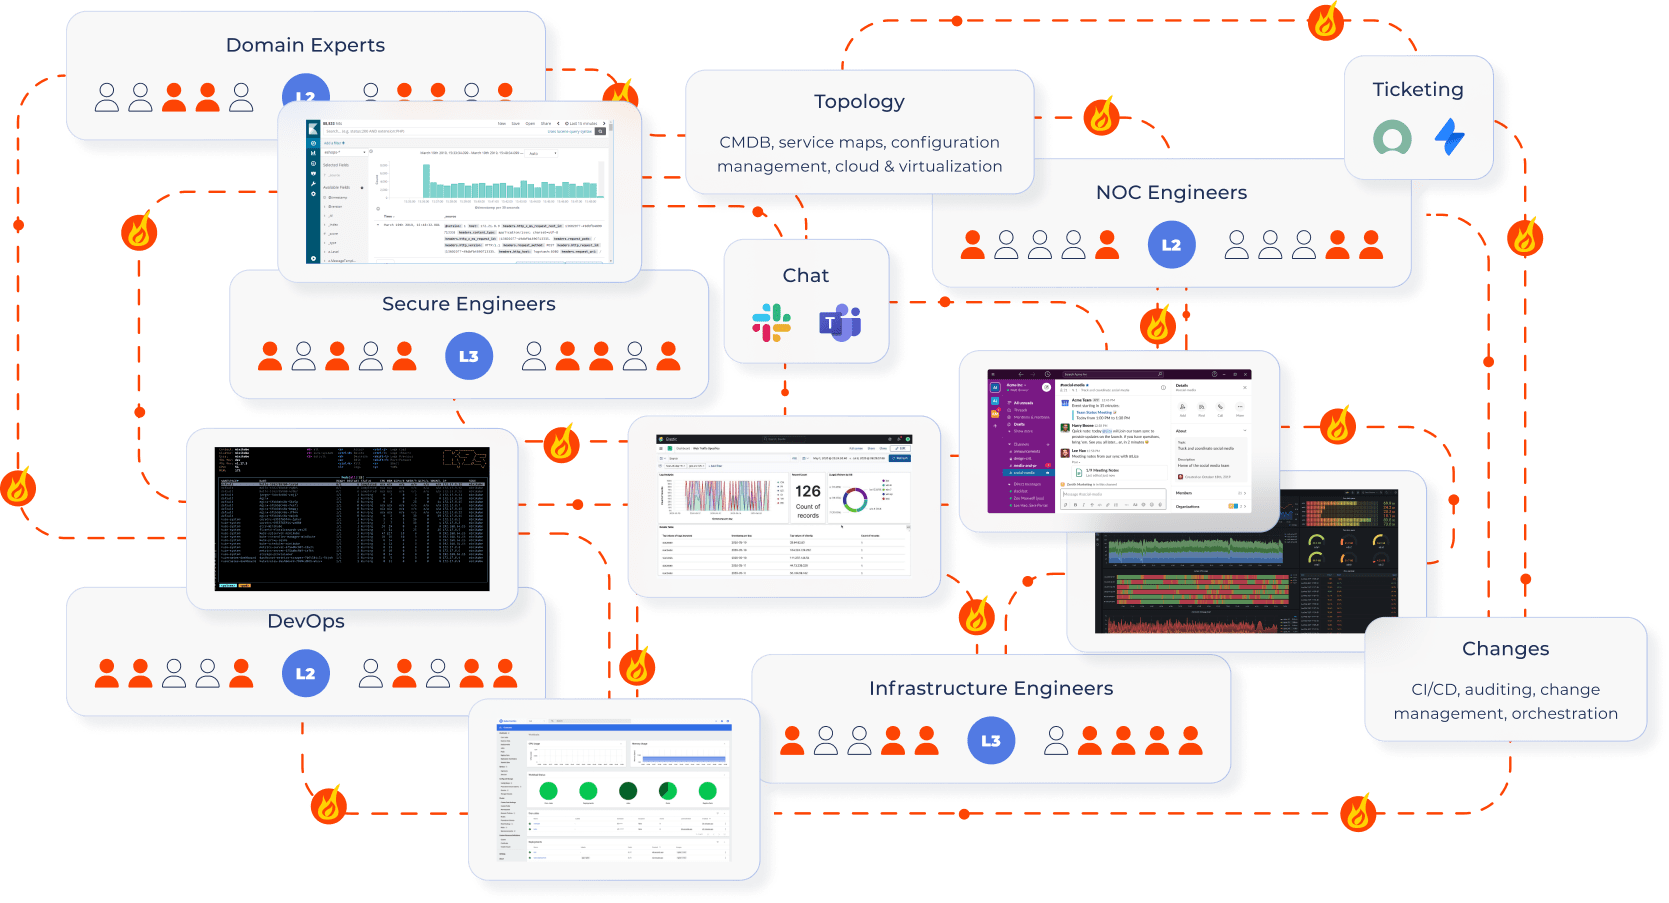
Experience Next-Level AIOPs Observability: Pre-built Integrations & Tailored Data Streams
Acure offers AIOps observability and dozens of ready-made connections, including monitoring systems, logs collection, data lakes, alarm systems, service desks, task trackers, and online messengers. Acure supports out-of-the-box integrations to streamline collaboration, tasks, incidents, notifications, and automation actions like SSH, cURL, REST API, SNMP, SMTP, C# Script, and Python.
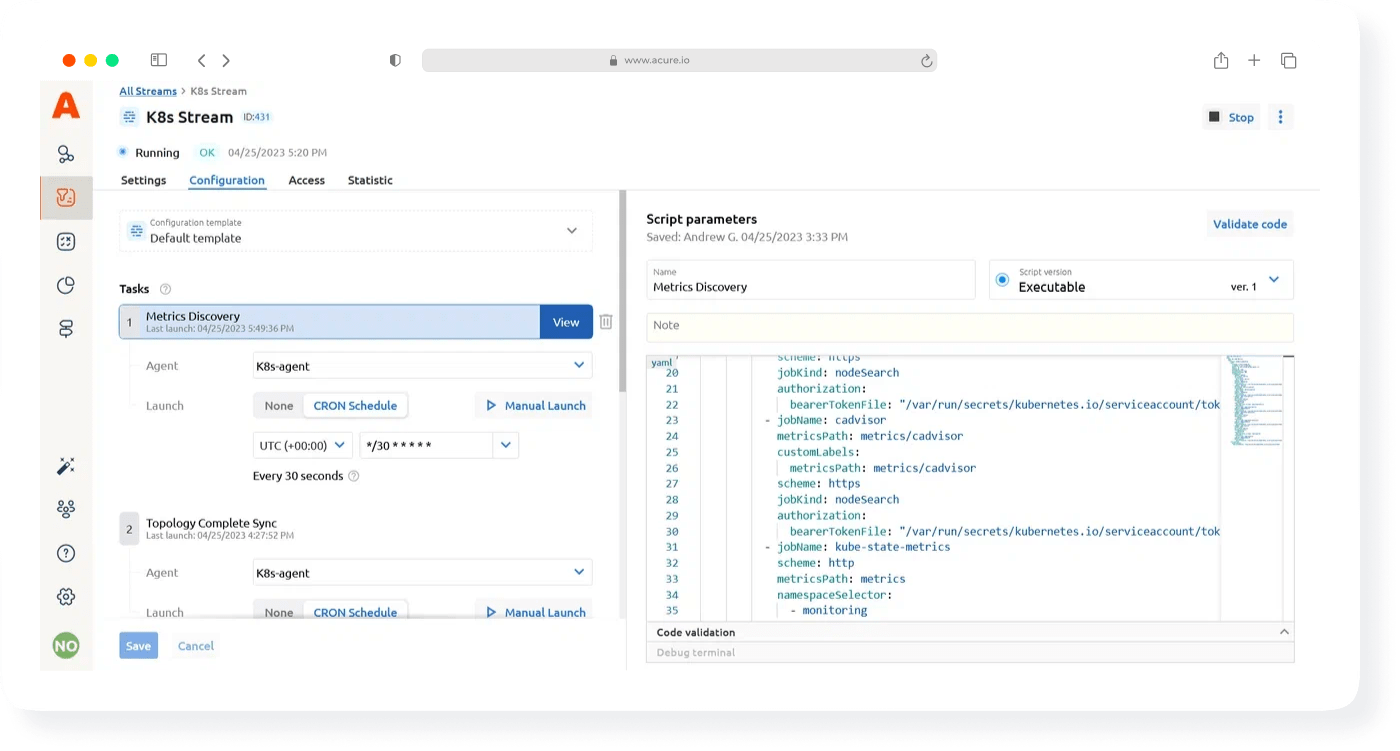
Easily connect other monitoring systems to Acure by setting up Data Streams. Acure supports both template-based and custom data source connections, allowing for maximum flexibility and compatibility with popular monitoring systems.


200+ Out-of-the-Box
Integrations
Integrations
Monitoring data:


Business data:

Topology:


Logs:
Tasks & Incidents:

Notifications:


Actions:
SSH, cURL, Rest API, SNMP, SMTP, C# Script, Python
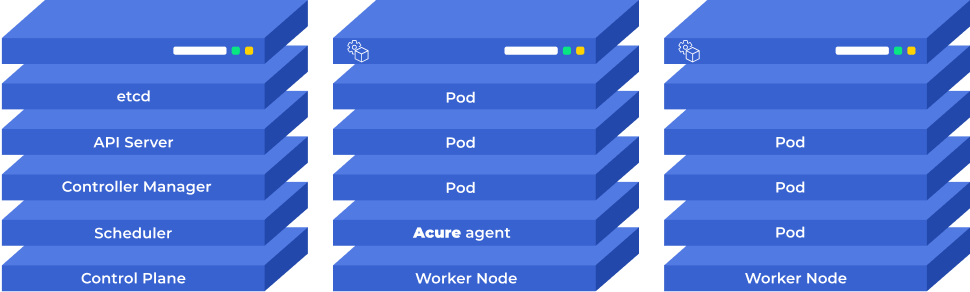
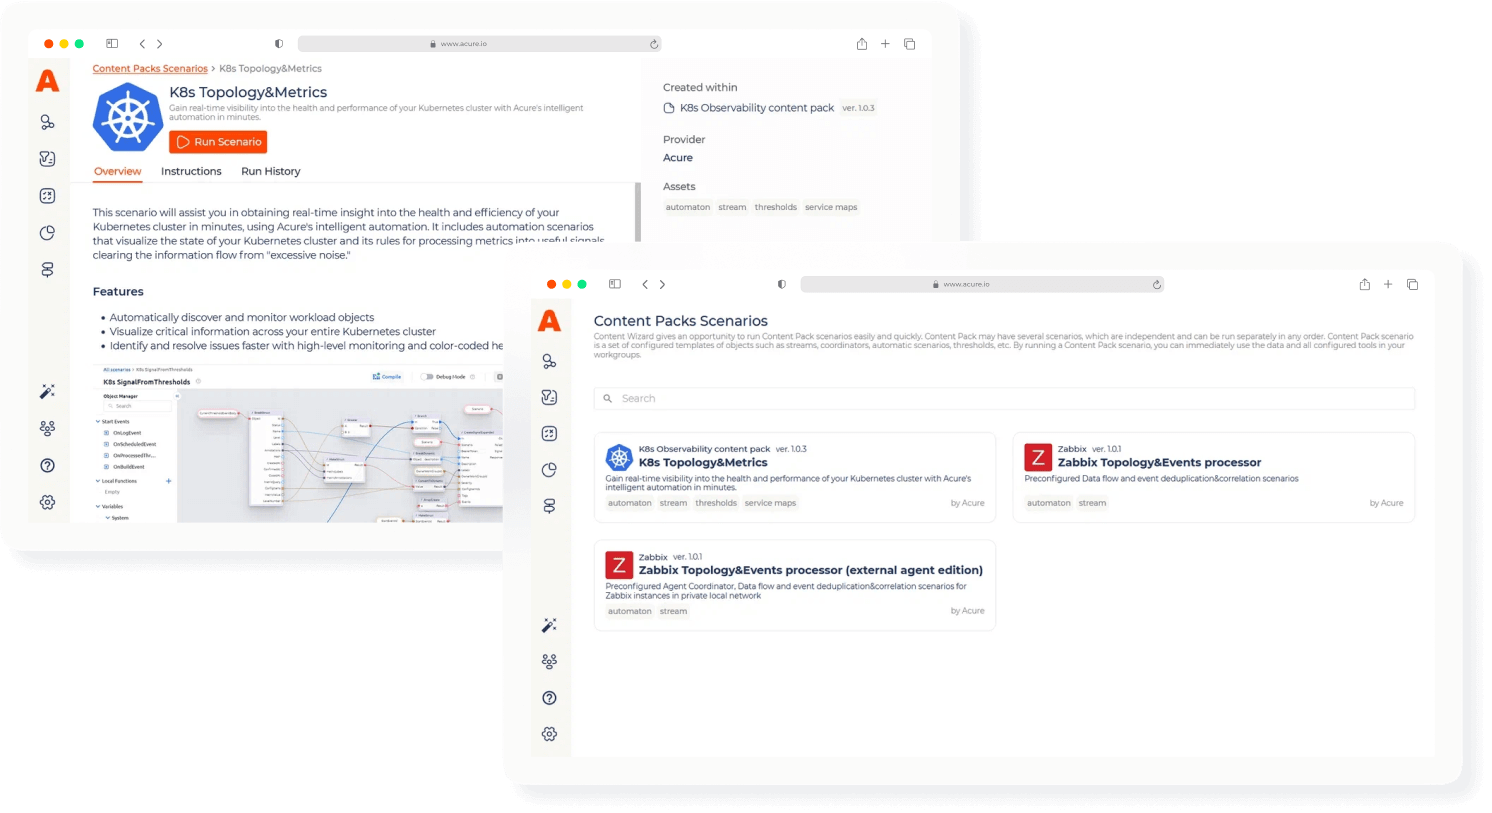
Master Kubernetes Monitoring in 2 Steps: Agent Installation & Preconfigured Content Pack Activation
Easily monitor and manage all your critical Kubernetes environments with Acure's agent and Kubernetes content pack. The agent monitors native Kubernetes and managed services like EKS, AKS, and GKE, only requiring view rights for added security.
1.Install the Acure agent using our Helm chart or manually using kubectl.
The Acure agent, launched as a deployment on one of the worker nodes, collects information and metrics from the Kubernetes API and passes it to Acure's metric and event collectors.
2.Start using our preconfigured objects included in the content pack, and transform raw data into informative signals with just one click.
TData streams, automated scenarios, and key metric rules are all part of the package, ensuring comprehensive observability for your Kubernetes cluster.
Key metric rules included:
NodeTextFileCollectorScrapeError
NodeRAIDDiskFailure
NodeRAIDDegraded
NodeNetworkTransmitErrs
NodeNetworkReceiveErrs
NodeHighNumberConntrackEntriesUsed
NodeFilesystemSpaceFillingUp
NodeFilesystemFilesFillingUp
NodeFilesystemAlmostOutOfSpace
NodeFilesystemAlmostOutOfFiles
NodeFileDescriptorLimit
NodeClockSkewDetected
NodeClockNotSynchronising
KubeVersionMismatch
KubeStatefulSetUpdateNotRolledOut
KubeStatefulSetReplicasMismatch
KubeStatefulSetGenerationMismatch
Kubernetes ReplicasSet mismatch
Kubernetes Node ready
Kubernetes network unavailable
Kubernetes memory pressure
Kubernetes disk pressure
Kubernetes container oom killer
Kubernetes API server errors
Kubernetes API client errors
KubeQuotaFullyUsed
KubeQuotaExceeded
KubeQuotaAlmostFull
KubePodNotReady
KubePodCrashLooping
KubePersistentVolumeFillingUp
KubeNodeUnreachable
KubeNodeReadinessFlapping
KubeMemoryOvercommit
KubeletTooManyPods
KubeletServerCertificateRenewalErrors
KubeletServerCertificateExpiration
KubeletPodStartUpLatencyHigh
KubeletPlegDurationHigh
KubeletClientCertificateRenewalErrors
KubeletClientCertificateExpiration
KubeDeploymentReplicasMismatch
KubeDeploymentGenerationMismatch
KubeDaemonSetRolloutStuck
KubeDaemonSetNotScheduled
KubeDaemonSetMisScheduled
KubeCPUQuotaOvercommit
KubeCPUOvercommit
KubeContainerWaiting
KubeClientErrors
KubeClientCertificateExpiration
KubeAPITerminatedRequests
KubeAggregatedAPIErrors
KubeAggregatedAPIDown
CPUThrottlingHigh
Acure Goes Freemium: Get All Features with No Credit Card, No Trial Period
We are excited to announce a free version, now available for IT Ops, NOC, and SRE teams. With a range of features included, the freemium plan is the perfect solution for small and medium teams. Take advantage of the Kubernetes connection, one of the many content packs included in the freemium plan.
Cloud Advanced
€ 600 monthly
For small & medium enterprise
- Unlimited events
- Unlimited users
- Unlimited automation rules
- Up to 50 GB of daily incoming data
- Data retention period: 30 days
- Priority support (manager)
Cloud Free
€ 0
For individual use
- Unlimited events
- Unlimited users
- Unlimited automation rules
- Up to 500 MB of daily incoming data
- Data retention period: 10 days
- Basic support (community)
Enterprise
Contact us
For large businesses
- All Cloud Advanced version benefits
- Cloud and On-premise versions are both available
- Data retention period: up to 5 years
- Personal manager and dedicated support team
Acure Success Stories: Real-World Solutions and Transformative Results
Discover real-life examples of how Acure has helped IT departments in various organizations: improving observability, reducing troubleshooting time, increasing SLA, and lowering support costs.
Acure's clients have achieved success in diverse industries, including insurance, digital banking, industrial holdings, retail, and supply chain management.
Digital bank reduced IT troubleshooting time by 40%
Acure has revolutionized our IT infrastructure management, reducing troubleshooting time by 40% and improving SLA performance. Its automation features minimize errors and free up our team's time for critical tasks. Acure has truly transformed our IT operations, making them more efficient and reliable. I highly recommend Acure for organizations seeking to optimize their IT monitoring and incident management.
Unlock K8s Insights: Learn from DevOps Pros
Resources:
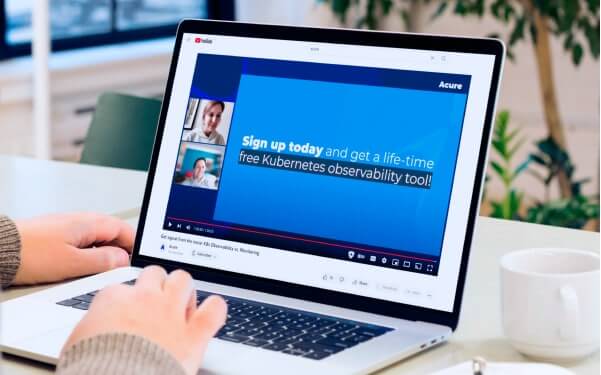
Get signal from the noise: K8s Observability vs. Monitoring

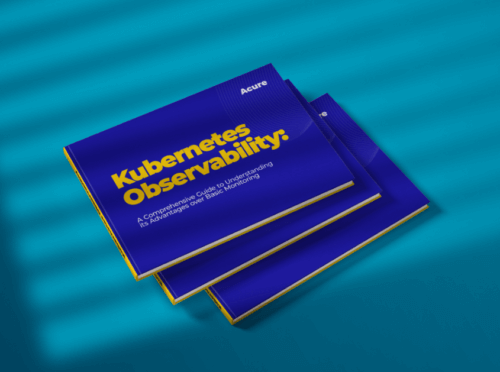
Download Kubernetes Observability Guide - Acure AIOps Platform

5 Best Kubernetes Books for Beginners
Expert Insights: 7 Kubernetes Blogs and Websites You Need to Know
Master Kubernetes Observability: The Ultimate Guide with Acure