We’re excited to bring you Acure 2.0! Now we are even closer to the concept of “Monitoring as a code”, we removed synthetic triggers replacing them with a dynamic correlation approach called signals and made the interface more compact. But first things first.
What Is Monitoring As A Code And What Does Acure Have To Do With It?
The concept of “monitoring as code” appeared on the Internet relatively recently. If we google “monitoring as code”, we will find references to this approach in many popular monitoring tools. However, if you dig deeper, it becomes clear that the described methods are just agent deployment and export setup using configuration management tools such as Puppet, Terraform or Helm. For the most part, these tools do not cover all monitoring and are limited to a simple data collection configuration.
“Monitoring as code” is not just automatic installation and configuration of agents, plug-ins and exporters. It covers the entire lifecycle, including automated diagnostics, alerts, incident management and automated troubleshooting.

From the very beginning, we at Acure have been guided by this concept. The automation scripts covered part of the monitoring cycle, but the 2.0 update is a milestone on the road to monitoring as code.
We Have Replaced Static Triggers With Dynamic Signals 🚦
In previous version of Acure, the main tool for deduplication and correlation of primary events (alerts and logs) were synthetic triggers controlled by rules in the form of Lua scripts. Despite their flexibility, the triggers were static, which was inconvenient when managing large dynamic environments. For each event, the user had to create a separate trigger with its own rule. With a large amount of constantly changing data the number of triggers could reach hundreds of thousands! All this generated additional labor costs when setting up and further working with the system.
As you already know, Acure easily syncs with other popular data monitoring systems. But static triggers gave rise to the problem of this constant synchronization – it was necessary to constantly monitor changes in synchronized systems. If a trigger was deleted or unlinked from a configuration item, the history was lost. In a dynamically changing environment, Acure would have a tough time overcoming these challenges.
This is where our favorite low-code engine saved the day! Thanks to it, we were able to replace synthetic triggers with signals driven by automation scripts.
Signal is similar to a task in a regular task tracker, and unlike a trigger, where only the status changes, the signal is a dynamic object. It opens on a specific event (or set of events), can attach other confirmation alerts in the process, and closes on an alert or event from the scheduler.
Find out more about the Acure 2.0 automation processes in the diagram below:

As you can see from this chain, the process architecture in Acure is event-driven :
1. The primary event in the form of raw data enters the system through Data Streams (push method) or with the help of Agents (pull method).
Push method involves sending data through the REST HTTP API (Data Stream API). This is how Prometheus , Ntopng , Fluentd and Nagios Core are integrated.
Pull method connects and collects data from monitoring tools using Agents. An agent is a special program that can be installed on a remote device to collect data and perform some action. The Agent receives tasks from the Acure server, executes them and transfers the collected information via a secure network protocol to the server. Through the pull method, integrations with Zabbix , SCOM, Nagios XI, vCenter are implemented .
2. After entering the system the raw event is transformed to the corresponding Acure structure via ETL logs. We can see events and alerts in the system at this point.
3. The automation script determines what kind of event we received: a monitoring event (a breakdown of some infrastructure object or service unavailability) or a topology change event (for example, creating a new configuration item (CI) or changing its name). Each of these cases has its own scenario (or group of scenarios).
In the second case, we are dealing with auto-discovery and the auto-building of the resource-service model: with the help of automation scripts, Acure enables the building of the topology of all IT services all without the use of manual labor. However, it is worth noting here that after the CI changes, the event correlated to this change also gets into the calculation of signals.
4. Now let’s move on to the main highlight of the recent update – signals.

A signal is a dynamic indicator of a change in the infrastructure with a start time and an end time. It reports the changes of any parameter from the regular state and is mainly intended for deduplication and correlation of primary events. With the help of signals, redundant copies are eliminated, and events are correlated – incidents are assigned the appropriate priority. Thus, with the help of automatic scripts, Acure not only reduces the user’s time for routine manual tasks, but also protects against information noise.
5. After the signal is created, the status of the configuration item is calculated. The CI attached to the signal takes over its criticality. For example, if a fatal level criticality is attached to some CIs, then the CIs are also painted in the corresponding bright red color. Changing the status of a CI recalculates its health and triggers the appropriate auto-actions (for example, team notifications, e-mails to users, or auto-repair scripts ). And all this happens automatically!
We Took A Course On Scenario Management 👨💻
Of course, there were scenarios in the case of triggers as well. Before binding (manually or via API) a trigger to the required configuration item, it was necessary to create a script for managing its statuses (manually or via a template), as well as an event prefilter. So a separate script was responsible for each individual trigger.
In the case of signals in Acure 2.0, the approach to their management has completely changed. In Acure 2.0, the management of signals is entirely handled by scripts. By analogy with the auto-building of the resource-service model all processes related to signals are implemented inside a script written using low-code. Within the script the opening/closing of signals takes place and the logic of their binding to configuration items is determined, as well as the attachment of events (alerts) to them. In addition, signals can be controlled by a whole set of scripts: you can create one huge alert deduplication script, which can be divided into many small ones without any restrictions.

In the same place, in the script, the configuration item is attached to the signal: directly from the script, you can access the CMDB functions, find the required CI by attributes and bind it to the signal. The binding logic can be absolutely arbitrary and depends only on the CMDB device and the log source settings.

Let’s have a look at the concept of signals using a simple example of alert deduplication. Imagine that in case of exceeding the threshold value of the metric, the source generates an exceeding alert every 5 minutes. In Acure, a signal is opened on the first event, all subsequent confirmations are attached to this signal. When the metric returns to its original state and there are no new alerts for this metric within 30 minutes, Acure closes the signal. If the situation repeats, a new signal is generated, while the previously triggered and already closed signals remain unchanged.
Such a dynamic scenario approach to problem management greatly simplifies the monitoring process, which is especially important for systems with a dynamic environment (containers, microservice architecture, Kubernetes). Simply put, instead of setting up a lot of static triggers and constantly monitoring their relevance, in the new version of Acure, it is enough to write a few scripts and forget about the old monitoring process – the system will do the rest, keeping with the motto “Monitoring as a code”.
We Made “A Single Pane Of Glass” Even More Single 🖥️
The presentation of data is just as important as the automation when comparing the effectiveness of monitoring. Understanding this, we revamped our approach to data visualization. Previously, an Acure user would have to repeatedly switch between several screens: the main, operational, timeline and resource-service model. The old way wasn’t significantly inconvenient but increased the time to fix the failure.
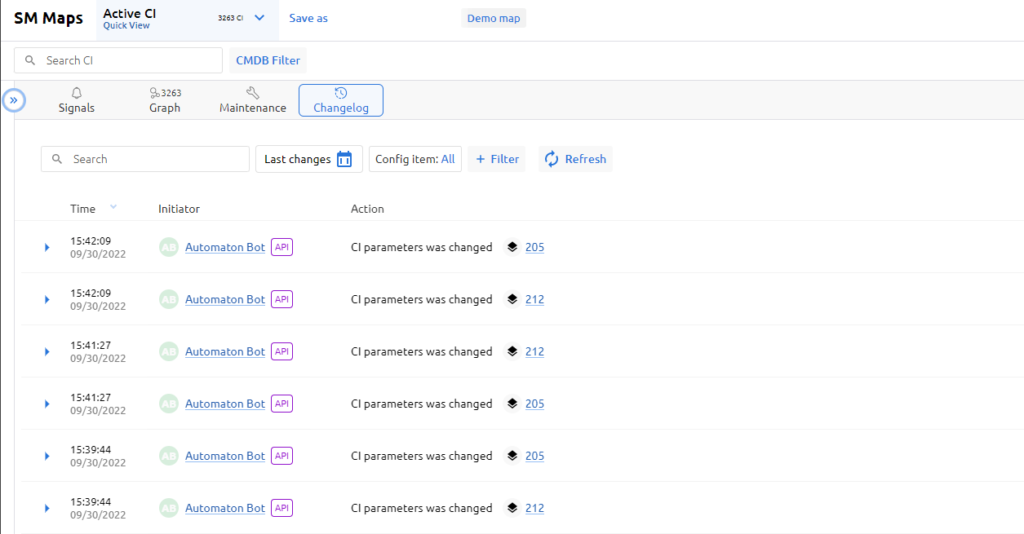
Now all the functions of the four screens are collected in a single monitoring window, where the monitoring panel is combined with the Service Model graph.

The single window is visually divided into two parts. In the left panel there is a list of filtered CIs, their health and status; in the right panel the information changes depending on the selected mode by the operator: Service Model graph, CI card, list of signals, service modes, Changelog. There are many different cross-links and filters on the screen.

Another feature is the functionality of transition points between maps. You can link maps to certain configuration items, after which transition points will appear on these configuration items. Making it now possible to move from one map to another directly on the Service Model graph.
This “one-stop shop” concept is designed to speed up the work with monitored objects, and thus minimize the time to solve the problem.