What Are Logs?
An event is recorded by a log, a time-stamped record produced by an application, operating system, server, or network apparatus. They may contain information about inputs from users, system functions, and hardware conditions.
A large portion of the information that provides a system’s observability can be found in log files, such as records of every event that occurs throughout the network devices, operating system, or software elements. Even user and application system communication is captured in logs.
The process of creating and keeping records for later examination is known as logging.

What Is Log Monitoring?
Designers and administrators regularly monitor logs as they are logged using the log monitoring technique. Using log monitoring software, units can gather data and raise alarms if system execution and fitness are affected.
DevOps teams (or development and operations teams) frequently use a log monitoring solution to ingest applications, services, and overall system logs to identify problems through the software delivery lifecycle (SDLC). A log monitoring system ascertains circumstances instantly to assist teams in troubleshooting problems before they hamper development or impact customers, whether a situation occurs during development, testing, deployment, or production.
Teams must, however, be capable of evaluating logs to identify root causes.
How Does Log Monitoring Facilitate Log Analytics

The notions of log monitoring and analytics are interrelated yet distinct from one another. Concurrently, they guarantee that apps and critical services are in good shape and running at their best.
While log analytics analyzes logs in context to comprehend their meaning, monitoring only tracks records. This involves resolving problems with software, services, apps, and any underlying infrastructure. Container environments, multi-cloud platforms, and data repositories are examples of this infrastructure.
Analytics and log monitoring work in tandem to guarantee that applications are running as efficiently as possible and identify areas where systems can be improved.
It is possible to find solutions to improve infrastructure environments’ predictability, efficiency, and resilience using log analytics. Together, they offer organizations a look into problems and advice on how to manage systems most effectively.
Reap the Benefits of Log Monitoring
In cloud-native systems, log monitoring aids teams in maintaining situational awareness. Numerous advantages come from this practice, which includes the following:
- Quicker response to and settlement of incidents: Teams can respond more quickly and find problems before they impact end users, thanks to log monitoring.
- More automation in IT: Teams can better automate more procedures and reply more accurately when they have clear visibility into crucial system KPIs.
- Enhanced system efficiency: Through log monitoring, teams can optimize system performance by identifying possible blockages and ineffective setups.
- Heightened cooperation: Cloud operators and architects gain from a singular log monitoring solution to build more dependable multi-cloud setups.
Log Monitoring Use Cases
Log monitoring can be applied to any connected device that creates an activity log. The spectrum of applicability for artificial intelligence-based solutions has expanded beyond break-fix situations to handle various technological and commercial issues.
They consist of the following:
- Modern cloud infrastructure is automatically monitored through infrastructure monitoring:
- Virtual machines and hosts;Platform-as-a-Service providers like Azure, AWS, and GCP;Platforms for containers like OpenShift, Kubernetes, and Cloud Foundry;Devices for networks, process detection, use of resources, and network performance;Integration of event data and from third parties; and
- Open-source applications.
- Microservices workloads operating within containers are discovered through application performance monitoring, identifying and locating problems before they impact actual users.
- Every application is made available, responsive, quick, and effective across all channels thanks to digital experience monitoring, which includes real-user monitoring, synthetic monitoring, and mobile app monitoring.
- Vulnerabilities are automatically found in cloud and Kubernetes environments by application security.
- IT and business collaboration is facilitated by business analytics, which offers real-time visibility into the company’s key performance metrics.
- By integrating observability, automation, and intelligence into DevOps pipelines, cloud automation and orchestration for DevOps and site reliability engineering teams accelerate the development of higher-quality software.
Overcoming the Challenges of Log Monitoring
In contemporary workplaces, it can rapidly become daunting to translate the deluge of incoming data and logs into compelling use cases. Although log monitoring remains crucial to IT procedures, doing it successfully in cloud-native settings presents specific difficulties.
The need for end-to-end observability, which allows users to gauge a system’s current condition on the basis of the data it produces, poses a significant barrier for companies. In addition, observability becomes more challenging as settings use hundreds of associated microservices spread across many clouds.
Organizations need more context as well. For example, logs are frequently aggregated nonsensically and assembled in data silos without any links. Without noteworthy connections, you often have to sift through billions of traces to determine whether two alerts are connected or the way in which they affect consumers.

Too frequently, logging technologies have engineers pouring over logs and browsing through data to determine fundamental causes using straightforward correlations. As a result, it is challenging to estimate consumer impact due to a deficiency of causation. It is also difficult to tell which optimization efforts are leading to performance gains.
Enterprises are frequently plagued by log monitoring’s elevated cost and blind spots. Many businesses remove sizable chunks of their logs to avoid the hefty data-ingest expenses associated with conventional log monitoring solutions. As a result, there is little sampling. Although rehydration and cold storage can reduce high costs, they are ineffective and lead to blind spots.
Traditional aggregation and correlation techniques must be improved, given the intricacy of contemporary multi-cloud settings. Teams must find bugs, abnormalities, and vulnerabilities as soon as possible. Organizations too frequently use various unrelated methods to handle multiple issues at different stages, which increases complexness.
Read our blog to learn more about log monitoring tools that are available for free.
Log Monitoring with Acure
Raw data coming into Acure from connected data streams are available in Events and Logs tab. Here you can filter it by period and pick the necessary interval which is very convenient for recurring events analytics and root cause analysis. Data are represented in two forms – table or JSON.
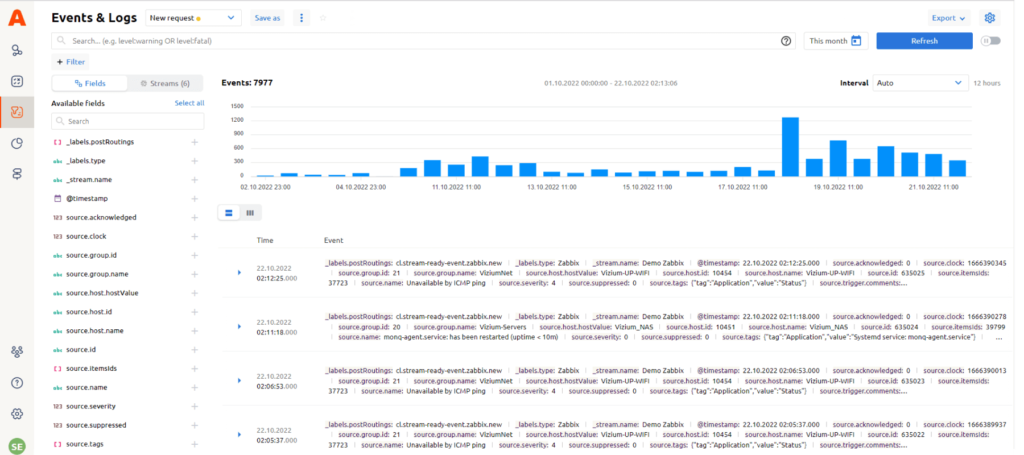
To collect raw logs, we recommend integrating with a logging and metric processor, such as Fluent Bit, which can either send raw logs or parse them. This type of integration is also configured with the AnyStream Default template.